News
EV Divide Grows in U.S. as More New-Vehicle Shoppers Dig in Their Heels on Internal Combustion
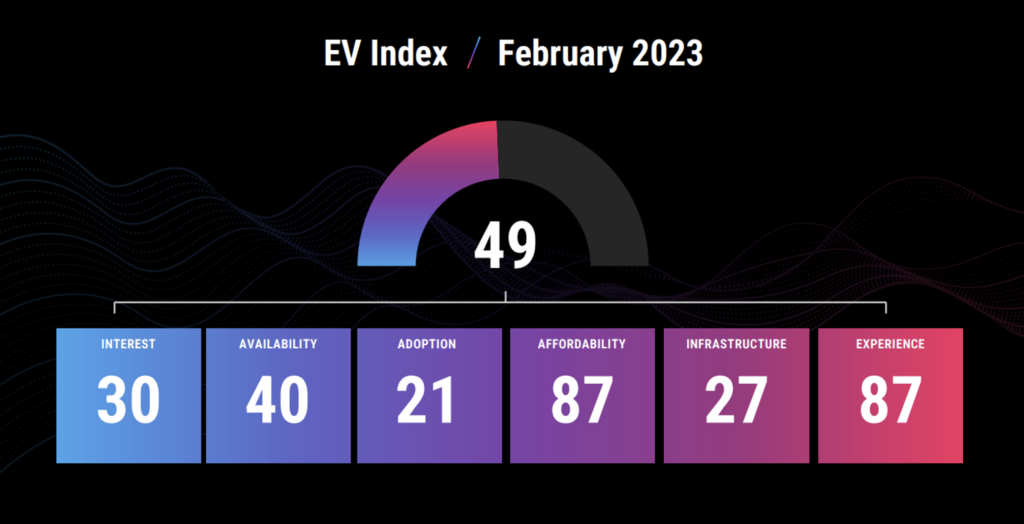
E-Vision Intelligence ReportApril 2023EV Divide Grows in U.S. as More New-Vehicle Shoppers Dig in Their Heels on Internal CombustionKey FindingsEV Holdouts Become More Resolute: Despite recent growth in electric vehicle (EV) market share, the percentage of U.S. consumers who say they are “very unlikely” to consider an EV for their next vehicle purchase has been growing steadily for the past three months, reaching 21% in March.Charging Infrastructure and Purchase Price Remain Biggest Barriers to Adoption: The top five reasons vehicle shoppers give for not considering an EV are all focused on public charging infrastructure and vehicle pricing.Ambiguity on Incentives Creates Challenges: New criteria introduced by the Internal Revenue Service (IRS), which limit tax credits on the sale of new EVs based on details of the chemical composition of their batteries, will reduce the affordability of EVs, potentially limiting future sales.Executive SummaryIt’s not all sunshine smooth sailing on the road to the EV future. While the long-term trend in EV market share has grown significantly from 2.6% of all new-vehicle sales in February 2020 to 8.5% in February 2023, sales hit a speed bump in March, with monthly market share falling to 7.3%. Although some month-to-month volatility is to be expected, a closer look at the barriers to EV adoption shows that many new vehicle shoppers are becoming more adamant about their decision to not consider an EV for their next purchase.According to new data from JD Power, this steady increase in the percentage of consumers who say they are “very unlikely” to consider an EV for their next vehicle purchase reflects persistent concerns about charging infrastructure and vehicle pricing.This E-Vision Intelligence Report dives into key data points trending in each monthly EV Index update, along with other data points gathered from JD Power studies and pulse surveys, to spotlight emerging trends and important shifts in EV consumer sentiment.Rise of the EV HoldoutsTop-line metrics on overall EV market share, availability and affordability have been on a long-term upward trend, but beneath those headline numbers we are starting to see some consumer behaviors that suggest a possible bifurcation of the automotive marketplace. Notably, when it comes to the percentage of new-vehicle shoppers who say they are “very likely” and “very unlikely” to consider an EV, the number of EV holdouts is growing more. As of this month’s report, 21% of new-vehicle shoppers say they are “very unlikely” to consider an EV, up from 18.9% in February and 17.8% in January. Meanwhile, the percentage of auto shoppers who say they are “very likely” to consider an EV is 26.9% and has been largely flat for the past three months.Charging Infrastructure, Price and Demographics All Play a RoleDigging deeper into the primary barriers to EV purchase consideration, we find remarkable stability in the top reasons consumers provide for sticking with internal combustion engine (ICE) vehicles. Lack of public charging infrastructure and price have been the top two concerns for the past 10 months, along with related issues involving range anxiety, time required to charge and power outage and grid concerns. Recent high profile infrastructure initiatives, such as Walmart’s plan to dramatically expand its charging network and Tesla’s announcement that would open some of its supercharger network to non-Tesla vehicles have apparently had little effect on these consumer concerns, at least so far. Demographics are also playing a role in these results. While it may not be surprising that the majority of Boomers[1] and Pre-Boomers aren’t considering EVs, fully one-third (33%) of Gen Z shoppers—the future of the marketplace—say they’re “somewhat unlikely” or “very unlikely.” It is clear in the data that price and charging infrastructure are significant obstacles for a wide spectrum of potential customers.New Tax Credit Rules Create ConfusionConsumer interest in EVs is heavily swayed by price, with our data consistently showing a clear correlation between consumer demand and government incentives, lease deals and manufacturer price cuts. Recently, that relationship has driven a surge in interest in vehicles like the Ford Mustang Mach-E and Tesla Model Y, which were reclassified as SUVs and became eligible for $7,500 federal tax credits under the Inflation Reduction Act (IRA).In mid-April, the IRS and the U.S. Treasury Department issued new guidance on specific vehicle requirements that need to be met before EVs can be eligible for these tax credits. These include the location where the vehicle is assembled and details on the sourcing of critical minerals used in the construction of vehicle batteries. On this last point, batteries and components must originate in the United States or come from countries with which there is a free trade agreement for the vehicle to qualify. This new hurdle will affect the affordability of several EV models, while also likely introducing more confusion among buyers. While we cannot yet forecast the exact effect this new guidance will have on EV adoption, our data suggest that higher prices will negatively affect EV sales. MethodologyThis JD Power E-Vision Intelligence Report is based on data and insights from the JD Power EV Index and the JD Power EV Consideration pulse survey. The JD Power EV Index is an analytics tool to benchmark the growing EV market in the United States. It tracks millions of data points aggregated into six categories—interest, availability, adoption, affordability, infrastructure and experience—to evaluate the progress to parity of EVs with ICE vehicles in the U.S. Each month, JD Power’s electric vehicle practice will analyze these data points, and others to spotlight emerging trends and important shifts in consumer sentiment that are helping to define the fast-moving EV marketplace. Find out MoreThis report was authored by Elizabeth Krear, vice president, electric vehicle practice; Brent Gruber, executive director, electric vehicle practice; Stewart Stropp, executive director, electric vehicle practice; Kristen Richter, senior manager, electric vehicle practice; and Karlo Vukobratovic, analyst, electric vehicle practice, JD Power. The JD Power E-Vision initiative is a company-wide program focused on maximizing JD Power industry-leading EV data, analytics, insights and solutions. Please contact us at the numbers below to connect with the authors or to learn more about the underlying research. Media ContactsShane Smith; East Coast; 424-903-3665; [email protected] Effler, JD Power; West Coast; 714-621-6224; [email protected] [1] JD Power defines generational groups as Pre-Boomers (born before 1946); Boomers (1946-1964); Gen X (1965-1976); Gen Y (1977-1994); and Gen Z (1995-2004). Millennials (1982-1994) are a subset of Gen Y.