• Average monthly residential electric, gas and water utility bills total $412 in 2025, up 7% from 2024
  • For Q4 2025, average monthly utility bills total $416, up 4.5% from Q3 2025 and 5.1% from Q4 2024
  • Electric utilities account largest share of wallet, gas shows sharpest price increase


Executive Summary:

As part of its ongoing analysis of customer experience with residential utilities, JD Power tracks the average prices customers pay for electric, gas and water services nationwide. This average price data is tracked in four waves over the course of the year, which are roughly in line with calendar quarters. The following are key highlights from the Q4 2025 analysis.

Average Household Utility Cost Rises 6% in 2025

The average amount paid for monthly residential electric ($189), gas ($122) and water ($101) was $412 in 2025. That’s an increase of 7% ($27) since 2024. On a quarterly basis, average monthly utility bills were $416 in Q4 2025, which is up 4.5% from Q3 2025 and 5.1% versus Q4 2024.  


Electric Utilities Account for Largest Wallet Share

Average monthly residential electric bills were $206 in Q4 2025, up 15.7% from Q3 2025 and flat with Q4 2024. The average monthly residential gas bill was $107 and the average monthly residential water bill was $103 in Q4 2025.


Gas Prices Show Sharpest Annual Rise

The average monthly residential gas utility bill was $122 in 2025, which represents a 13% increase over 2024 ($108). Residential gas utility bills have increased 45% between 2020 and 2025.


Total Share of Wallet

Monthly utility bills have come to occupy a significant share of consumers’ recurring household expenses. Based on a median annual household income of $80,610[1], monthly electric, gas and water bills now account for 6.1% of utility customers’ household income.


Find out More

This JD Power Quarterly Share of Wallet Tracker for residential utilities is based on data and insights drawn from the JD Power U.S. Electric Utility Residential Customer Satisfaction Study, the JD Power U.S. Gas Utility Residential Customer Satisfaction Study and the JD Power U.S. Water Utility Residential Custom Satisfaction Study.


Media Contacts

Brian Jaklitsch; East Coast; 631-584-2200; [email protected] 

Joe LaMuraglia, J.D. Power; East Coast; 714-621-6224; [email protected]


[1] United States Census Bureau https://www.census.gov/library/publications/2024/demo/p60-282.html 

Utilities Intelligence Report
January 2026


Key Insights

  • Midterm elections will fan flames of rate debate:  Average monthly residential electric utility costs have surged 34% since 2020, reaching $189 for the full year 2025—the highest annual average ever measured by JD Power. This will make an easy talking point for politicians running for midterm elections and a palpable pain point for customers who are struggling to pay their bills.
  • Extreme weather and outages put spotlight on communication: More than half (55%) of utility customers nationwide experienced a power outage in 2025, putting increased pressure on utilities to deliver proactive communication before, during and after power restoration.
  • Cannot afford to ignore technology: More customers than ever are turning to utility websites and apps as their first line of communication, yet nearly one-in-five (19%) encounter problems with slow or poorly organized websites and nearly one-third (28%) of utilities still do not offer mobile apps.

Executive Summary

The nation’s electric, gas and water utilities have their work cut out for them in 2026. A combination of record-high rates, widespread outages and evolving customer expectations for how to access important information and engage with service providers are challenging the status quo. In many cases, utilities have become high-profile consumer brands and that makes them subject to an increased level of public scrutiny, especially when things do not go as planned.

This Utilities Intelligence Report dives into key data points gathered from JD Power studies and proprietary market data to offer a data-driven perspective on the biggest issues confronting utilities as we head into 2026.

Affordability Now Frames Every Conversation

Monthly utility bills have come to occupy a significant share of consumers’ recurring household expenses, with the average monthly electricity bill reaching $189, the average monthly gas bill at $122 and the average monthly water bill hitting $101 through 2025. Electric bills in particular hit record highs in 2025, and customers are feeling the pain, with 22% indicating they are unable to pay their full bill or currently owe an outstanding amount to their utility.

Average Bill

These rising household costs have already become a major talking point for politicians running for midterm elections and will continue to make headlines following rate cases and key economic data releases. To counteract this negative attention, utilities will need to strengthen their affordability initiatives, proactively communicate upcoming rate changes with explanations for why changes are occurring, and expand assistance programs to support financially stressed customers. JD Power data shows that when utilities have strong brand appeal perceptions, 37% of their customers trust them to set fair rates. Meanwhile, when utility brand appeal is weak, only 10% of customers trust them to set fair rates. Utilities will need to highlight the steps they are taking to help customers manage affordability challenges in 2026.

Right or Wrong, More Customers Blame AI for High Electric Costs

Rising raw materials costs, natural disasters and increased demand are some of the reasons for the steady rise in residential electric utility bills over the past several months, but one culprit in particular has increasingly sparked customer ire: the rapid expansion of data centers to support AI. 

In fact, data centers in the United States accounted for 4%1 of total power demand in 2025. While that is a marked increase over the past five years, it does not translate directly to higher rates at every local electric utility in the nation. Still, 16% of electric utility customers say they feel AI/data centers have played a role in increasing their utility bills in the past year. For the most part, electric utilities have not been communicating with their customers about the factors driving increased demand, but that needs to change. In the absence of proactive communication that clarifies data centers aren’t the sole reason for rising rates, speculation will continue to grow. 

Cost Factors

Extreme Weather and Service Disruptions Create Sense of Urgency

Overall, 55% of utility customers nationwide say they have experienced a power outage in 2025. Of those outages, 47% were due to extreme weather such as a hurricane, ice or snowstorm, thunderstorm, wind or tornado or fire. These extreme weather events were so violent that 17% of customers who were affected by a natural disaster say they had to evacuate their homes. 

Experienced Outage

Customer satisfaction with residential electric utility providers is significantly higher when customers receive timely, accurate outage information. Utilities that proactively communicate about power outages earn satisfaction scores that are 52 points higher (on a 1,000-point scale), on average, than utilities that do not proactively communicate with their customers. Similarly, utilities that proactively reach out to their customers to share information about infrastructure investment and improvements being made to the grid have overall satisfaction scores that are 82 points higher than those that do not.

Utilities should enhance proactive communication strategies, invest in accurate outage maps and ensure customers receive timely alerts. Proactive, multi-channel communication (text, email, phone) will be essential for building trust and improving reliability perceptions, particularly in response to unpredictable events.

Digital Engagement and Self-Service Become Critical

More customers than ever are turning to utility websites and apps as their first line of communication when it comes to questions about billing, service disruptions and other customer service issues, yet nearly one-in-five (19%) encounter problems with slow or poorly organized websites and nearly one-third (28%) of utilities still do not offer mobile apps.

Among water utility customers, for example, just 20% say they have recently reached out to their utility via phone, while 37% say they have used an app or gone to their water utility’s website seeking information. Moreover, customers who use digital channels have overall satisfaction scores that are 43 points higher (on a 1,000-point scale) than those who use the phone.

Water Utility Satisfaction

As more customers continue to pursue digital means of problem resolution as their first line of communication, many utilities will need to strengthen their customer support technology to keep pace with rising expectations.

Find out More

This Utilities Intelligence Report is based on data and insights gathered across all JD Power Utilities Intelligence studies conducted during 2025. It was authored by Andrew Heath, vice president, Utilities and TMT Intelligence; Chris Oberle, managing director; John Hazen, managing director; and Mark Spalinger, director of Utilities Intelligence at JD Power.

Please contact us at the numbers below to connect with the team or to learn more about the underlying research.

Media Contacts

Brian Jaklitsch; East Coast; 631-584-2200; [email protected] 
Joe LaMuraglia, JD Power; East Coast; 714-621-6224; [email protected] 


1 Pew Research Center, “What we know about energy use at U.S. data centers amid the AI boom,” October, 24, 2025 https://www.pewresearch.org/short-reads/2025/10/24/what-we-know-about-energy-use-at-us-data-centers-amid-the-ai-boom/ 

Utilities Intelligence Report
October 2025                  


Disasters Become a Fact of Life for Many U.S. Electric Utility Customers 
Extreme Weather to Blame for Half of all Outages Reported in First Half of 2025

Disasters, such as the Los Angeles wildfires and severe spring and early summer thunderstorms that caused flash floods throughout many parts of the United States, have contributed to more than $131 billion in global losses in the first half of 2025. They have also created a new set of challenges for the nation’s electric utilities—and their customers—who were already straining under the weight of rising costs, aging infrastructure and an uncertain economy.

In response to the increased frequency and severity of extreme weather events, JD Power expanded its U.S. Electric Utility Residential Customer Satisfaction Study methodology to better understand the impact of weather-related power outages and service disruptions on customers. This Utilities Intelligence Report dives into key data points gathered from JD Power studies to chart the scope of power disruptions throughout the first half of 2025 and identify strategies utilities can use to help mitigate the negative effects of extreme weather on their customers. Data collected in this report is from 2025 and includes weather events from 2024 and 2025.

Longer Outages Affecting More Regions of the Country

Overall, 45% of utility customers nationwide say they have experienced a power outage in the first half of 2025. Of those outages, 48% were due to extreme weather such as a hurricane, ice or snowstorm, thunderstorm, wind or tornado or fire. These extreme weather events were so violent that 17% of customers who were affected by a natural disaster say they had to evacuate their homes.

Average length of longest outage (hours) chart

Accordingly, the average length of the longest power outage in the U.S. has increased in all regions since 2022. Customers in the South of the United States report the longest outages (18.2 hours), followed by the West (12.4 hours). 

Accordingly, the average length of the longest power outage in the U.S. has increased in all regions since 2022. Customers in the South of the United States report the longest outages (18.2 hours), followed by the West (12.4 hours).

Southern U.S. in the Eye of the Storm

The majority of customers who are affected by a recent disaster are in the South, double the national average. And when the South experiences a disaster, it has bigger energy ramifications than any other region. Customers in the South experienced more electricity loss than any other region (77%) in the aftermath of extreme weather events. Its average outage length when the outage is caused by extreme weather is 95.2 hours. They also had the most property damage (36%) and the second-highest rate of evacuation (17%).

Average length of outage by cause of outage chart

Wildfire Plagues the West

In the West, 4% of the region experienced an outage due to fire. What’s more, 6% of the region experienced an outage due to a proactive shutoff by the utility.

Impacted by recent disaster in your are chart

Maintaining Customer Satisfaction Under Duress

The overall customer satisfaction scores for all electric utilities nationwide is 504 (on a 1,000-point scale) through the first half of 2025. Despite widespread outages, the South leads the nation with a score of 530—surpassing the national average and outperforming the East (477), Midwest (516), and West (481).

Strong customer satisfaction scores among utilities in the Southern U.S. are being driven by high marks in safety, reliability, ease of service, trust, and digital experience. Overall, more than half (57%) of customers feel their electric utility is the entity most responsible for educating the public on electric safety, and the region had the highest marks of customers receiving information from their utility on how to prepare for the disaster via text message (29%). This suggests that easy, accessible communication can move the needle on customer satisfaction, even in the face of loss of power, property and displacement.

Overall satisfaction by scores used to get outage information chart

Controlling the Controllables 

Given the increase in disasters, how can customer satisfaction stand up in times of increasingly frequent events and ensure service reliability and customer safety?  Utilities in the South have shown it can be done, provided utilities understand what customers truly value.

When extreme weather strikes, customers are on the hunt for reliable and accessible channels to get information. Many assume that electrical utilities will be that channel, as 44% of customers say they want electric safety information from their utility that will help them prepare for a storm/weather event, and 35% want to know what to do in the event of an extensive outage. What’s more, when a utility reaches out directly in the aftermath of an outage, customer satisfaction increases dramatically. 

Utility post restoration contact impact on satisfaction chart

The South is acting as a benchmark on how building trust, providing accessible digital tools and maintaining effective communication can positively impact customer satisfaction. While the South has plenty of weather variables to contend with, many of the region’s utilities have found a way to provide that guidance and boost overall customer satisfaction. With weather events as unpredictable as ever, utilities will need to find a way to control what they can. That starts with a better flow of information – before and after an extreme weather event.

Find out More

This Utilities Intelligence Report is based on insights from the JD Power U.S. Electric Utility Residential Customer Satisfaction Study, the JD Power U.S. Electric Utility Brand Appeal Index Study, the JD Power U.S. Utility Digital Experience Study and the JD Power U.S. Sustainability Index. It was authored by Mark Spalinger, director of utilities intelligence at JD Power. Please contact us at the numbers below to connect with Mr. Spalinger or to learn more about the underlying research.


Media Contacts
Brian Jaklitsch; East Coast; 631-584-2200; [email protected]

Joe LaMuraglia, JD Power; East Coast; 714-621-6224; [email protected]


Utilities Intelligence Report

Quarterly Share of Wallet Tracker: Residential Electric, Gas and Water

Q2 2025


Average Household Utility Costs Rise 41% in Last Five Years 

As part of its ongoing analysis of customer experience with residential utilities, JD Power tracks the average prices customers pay for electric, gas and water services nationwide. This average price data is tracked in four waves over the course of the year, which are roughly in line with calendar quarters. The following are key highlights from the Q2 2025 analysis.

Key Findings

Average Monthly Household Utility Costs Up 41% Since Q2 2020: The average amount paid for residential electric ($184.00), gas ($141.00) and water ($99.00) is $424.00 through the second quarter of 2025. That’s an increase of 5% ($19) since Q1 2025 and an increase of 41% ($122.43) since the second quarter of 2020 in total residential utility costs. 

Average Monthly Utility Costs 2020-2025 (Line chart)

Gas Prices Up 60% in Five Years: The average amount paid for a monthly residential gas utility bill is $141.00 through Q2 2025. That is $15.00 per month more than the average price paid in Q1 2025, and $53.00 more than Q2 2020 figures, a 60% increase over the past five years.  


Total Share of Wallet
Monthly utility bills have come to occupy a significant share of consumers’ recurring household expenses. Based on a median annual household income of $80,610[1], monthly electric, gas and water bills now account for 6.3% of utility customers’ household income, up from 4.5% in Q2 2020.

Any incremental movements on a quarterly or annualized basis can have a material effect on not only customers’ overall satisfaction with their utility providers, but also their purchasing power. While most residential utility customers are now seeing declines from some of the sharpest increases in utility bills experienced during 2023, the longer-term trend in price increases shows just how significant a portion of monthly consumer outlay utilities have come to represent.

Methodology 

This JD Power Quarterly Share of Wallet Tracker for residential utilities is based on data and insights drawn from the JD Power U.S. Electric Utility Residential Customer Satisfaction Study, the JD Power U.S. Gas Utility Residential Customer Satisfaction Study and the JD Power U.S. Water Utility Residential Customer Satisfaction Study.

Find out More

This report was compiled by the utilities intelligence team at JD Power. Please contact us at the numbers below to learn more about the underlying research.

Media Contacts

Brian Jaklitsch; East Coast; 631-584-2200; [email protected] 

Geno Effler, JD Power; West Coast; 714-621-6224; [email protected]


[1] United States Census Bureau https://www.census.gov/library/publications/2024/demo/p60-282.html 

Utilities Intelligence Report
January 2025


The nation’s electric, gas and water utilities are at a crossroads. Environmental conditions and catastrophes are forcing stakeholders to face a reckoning about what a sustainable future looks like. But with utility customers already bearing a heavier rate burden, finding a way to get customer buy-in for costly, sweeping initiatives seems too wide of a gap to bridge. 

Utilities find themselves grappling with tough questions. What do customers truly value in their relationship with their respective utilities? Which programs can move the needle on customer satisfaction? Can they find a way to not only move themselves into the future, but ensure their customers are willing to come along for the ride?

JD Power has been tracking customer sentiment with all aspects of utility service and delivery for the past two decades, evaluating everything from customer satisfaction with the price, reliability and service of local utilities to opinions on sustainability and clean-air initiatives. Based on those accumulated insights, below are JD Power predictions for the biggest trends to watch in the year ahead.

Sky High Prices Paint Utilities into a Corner

With customers facing surging prices— the average residential electric bill, for example, increased to a record-high $182 per month in 2024, according to JD Power data—the industry average for customer satisfaction has declined consistently. Average customer satisfaction was as high as 751 (on a 1,000-point scale) as recently as 2020. In 2024, that number dipped to 708.

That doesn’t necessarily mean that utilities are destined to a fate of poor customer relationships. While higher rates certainly put utilities at a disadvantage, some are starting to decipher which issues can move the needle on customer satisfaction. For example, customers have strong recall about paperless billing, but this program does very little to improve customer satisfaction rates. Meanwhile, when utilities explain reasons behind a rate hike or how they’re investing in alternative energy initiatives, customers are more likely to be satisfied with their utility. The problem is that few customers recall utility communication on these issues, which suggests they may be focused on the wrong things. 

In 2025, more utilities will look for a way to balance those scales and build deeper relationships that foster trust and loyalty. Those that do can buck the trend with customer satisfaction.

Customer Support for Sustainability Will Surge                                                    

As new sustainability regulations begin to take hold, sustainability and businesses’ effect on the climate are under increased scrutiny from not just regulators but investors, public authorities and customers. And with more than 83% of U.S. electric customers now served by a utility with a carbon reduction target, many utilities describe their sustainability strategy as their business strategy. 

Since 2020, JD Power has been measuring the level of residential and business customer support for these sustainability goals. The metric includes awareness of the goal, customer engagement with the plan, and advocacy for the local electric utility’s clean energy plans. Since the inception of the J. D. Power Sustainability Index, no electric utility has secured a rating of 50 or more on the index’s 100-point scale. 

As utilities increase their communication and customers learn more about the goals and initiatives, it is possible that one (or more) of the leading utilities reaches or surpasses the 50-point threshold. For utilities with urgent goals, such as net-zero by 2030, this would be positive news as they move towards meeting their clean energy goals. The final step is securing the level of customer support required to achieve these plans.

Responsibility Reigns Supreme

Ask the average customer how appealing it is to do business with their utility. Odds are, it won’t be an outpouring of love and praise. Utilities do boast strong trust scores, high marks for service and reliable brand identities, but they significantly lag on establishing strong reputations of being customer or community focused and lag on perceptions of being environmental stewards. In fact, when asked about their respective utility in the JD Power 2025 U.S. Brand Appeal Study customers gave utilities a 4.39 rating (on a 7-point scale) when asked if the utility supports causes they care about. When it came to reliability, however, the average rating was a more respectable 5.18. 

Because of this reputational lag, many utilities have started to re-brand around value propositions that go beyond the table stakes traits of service and trust. More and more, utilities are likely to expand their perceptions to include the programs, offerings and efforts they have developed to align their images around the expectations of their customers and communities they serve. 

Gas Goes Digital

Customer satisfaction for residential gas declined significantly in 2024. Residential gas utilities saw their overall satisfaction drop 11 points, with lagging scores on digital experience serving as a major driver of the decline. In fact, 33% of digital customers had a problem accessing their utility’s digital services.

This performance makes digital experience a clear point of emphasis for these utilities in the coming year, as many will turn to next generation artificial intelligence and other tools to help anticipate customer needs and allow them to respond through digital channels to resolve service issues faster and more easily.

Communication Will Unlock Satisfaction

In 2025, utilities will revisit the importance of customer experience and reinvest in customer experience as residential satisfaction levels continue to decline. 

With increasing competition from alternative energy providers, increasing customer expectations and growing frustration over service reliability and communication, utilities will realize that maintaining a satisfied customer base requires a more customer-centric approach. To address these concerns, utilities will shift focus toward improving customer support by improving their omnichannel communication solutions, such as more personalized features on mobile apps, AI-driven chatbots and improved text alerts (e.g., outage and billing). These tools will help create smoother, more responsive interactions and ensure customers can easily resolve issues without long wait times or frustrations.

Additionally, utilities will focus on more targeted and personalized communications. To deliver on that promise, utilities will make investments in data analytics and enhanced ways to communicate about service reliability, billing and payment and program offerings. In 2025, utility companies will leverage advanced data-driven platforms to predict customer needs, detect issues earlier, and provide customers with real-time updates about outages, estimated restoration times and service changes. By offering customers more visibility into their energy usage and offering personalized recommendations, utilities can empower customers to make better decisions about consumption. This transparency not only builds trust but also gives customers greater control over their energy bills and usage patterns, addressing concerns around pricing and unexpected spikes in energy costs.

As a result of this reinvestment in customer experience, companies will foster deeper connections with customers by aligning their operations with customer needs. These efforts will help utilities build stronger customer loyalty, increase satisfaction and position themselves as leaders in a rapidly evolving energy landscape.

Find Out More

This Utilities Intelligence Report is based on data and insights gathered across all JD Power Utilities Intelligence studies conducted during the course of 2024. It was authored by Andrew Heath, vice president, utilities and TMT intelligence; Chris Oberle, managing director; Maureen Russolo, senior director; and Mark Spalinger, director of utilities intelligence at JD Power.

Please contact us at the numbers below to connect with the team or to learn more about the underlying research.


Media Contacts

Brian Jaklitsch; East Coast; 631-584-2200; [email protected]

Geno Effler, JD Power; West Coast; 714-621-6224; [email protected]

Utilities Intelligence Report
January 2025

Power pole for an electric utility

It’s been impossible to escape the headlines about stratospheric electricity bills. According to JD Power data, the average residential electric bill increased to $182 per month in 2024, a record high. It’s the latest in a steady incline that has seen prices surge 27% since 2021. Accordingly, the level of customer satisfaction for utility customers has fallen precipitously during that same period.

As utilities bear the brunt of these disgruntled customer bases, they need to find ways to ensure their relationship with their customers is deeper than the cost of their monthly meter reading. Unfortunately, utilities’ communication strategies seem to be focused on the wrong issues, and many continue to miss the mark on what issues truly move the needle on customer satisfaction.

Prices Continue to Climb                                         

In light of record high prices, it shouldn’t come as much of a surprise that just 31% of electric utilities have either improved their customer satisfaction or held steady; the rest have all declined.

pic 1.2

The slump in satisfaction clearly correlates with the gradual rise in prices. The industry average for customer satisfaction has declined consistently since prices began to rise. Average customer satisfaction was as high as 751 (on a 1,000-point scale) as recently as 2020. In 2024, that number dipped to 708. 

pic 2.2

The Communication Conundrum

For utilities to stave off the negative effects of rate increases, they need to create avenues for open dialogue, particularly around key, hot-button issues that are proven differentiators.

For example, customers in California must to grapple with planned power grid shutoffs to conserve energy. And in a world that is increasingly polarized about energy consumption and conservation issues, it would be logical to assume that hearing more about utility sustainability initiatives would not improve customer attitudes. But surprisingly, customers who are aware of their utility’s efforts to use clean energy had a customer satisfaction score of 780, compared with 682 for those who were unaware (on a 1,000-point scale). 

That doesn’t mean that utilities can quell angry customer concerns with investment in green initiatives. But it does illustrate the need for utilities to learn what issues they need to put at the center of their communication plan.

pic 3.2

For example, customers clearly recalled messaging on paperless billing, but it is not increasing their overall satisfaction. Meanwhile, when customers can recall utility messaging on corporate citizenship or environmental issues, they do show an ability to make inroads on satisfaction, even more so than emergency preparedness alerts. The problem is that there is limited recall on these issues.

Strategies that Work

Many utilities need to get rate hikes cleared by their customers, which makes communication around these issues vital to their operations. Utilities need to foster strong bonds that will keep customers on board with their plans.

Those that can effectively walk the line with their customers between energy chaperone and engaged partner will meet far less resistance to their rate hikes and will create better bonds in their community that will come in handy, whether that’s in the face of the next rate increase or in the aftermath of natural disaster. The key is to effectively message the right points.

Find out More

This Utilities Intelligence Report is based on responses from U.S. Electric Residential utility customers nationwide and was fielded from January through November 2024. It was authored by Mark Spalinger, director of utilities intelligence at JD Power. Please contact us at the numbers below to connect with Mr. Spalinger or to learn more about the underlying research.


Media Contacts

Brian Jaklitsch; East Coast; 631-584-2200; [email protected]

Geno Effler, JD Power; West Coast; 714-621-6224; [email protected]


Utilities Intelligence Report

August 2024

Amid a seemingly non-stop barrage of safety alerts and growing concerns about contamination and supply shortages, Americans are using more water than ever before.

The combined water and sewer bill for a typical household in the United States has increased 54.8% since 2012, even as utility customers have serious reservations about the quality of the very water they’re consuming. According to JD Power data, 41% of customers say they do not feel the water provided by their local utility is safe to drink.

That’s created quite a quandary for local water utilities, as they wrestle with providing uninterrupted, high-quality service, while figuring out a way to effectively tamp down fears about water safety. Some water utilities are doing a much better job than others when it comes to customer perceptions of water quality.

Methodology

Each year, JD Power gathers feedback from customers of water utilities in its U.S. Water Utility Residential Customer Satisfaction Study. The study measures satisfaction among residential customers from 92 water utilities that deliver water to populations of at least 400,000.

For this report, JD Power drilled into the data of the 2024 U.S. Water Utility Residential Customer Satisfaction Study to further examine consumer perceptions about the quality of their water. Customers were asked to rate the quality of water in terms of taste, color, odor, hardness, and other factors on a scale of 1-10. 1 being unacceptable, 5 being average and 10 being outstanding. States are then ranked based on the percentage of customers that respond positively about their water from best and worst. This year’s study is based on the responses of 32,833 residential water utility customers and was conducted from June 2023 through March 2024.

Tap, Please

After tallying the results, Washington State took home the top spot with 84.5% of customers giving their water positive marks. This comes amid recent news that the state will move to tougher federal limits on PFAS chemicals.


Washington

84.5%

Kansas

81.4%

Hawaii

80.0%

Kentucky

79.3%

Massachusetts

79.3%

New York

78.7%

Connecticut

77.7%

Georgia

76.5%

Louisiana

76.5%

Virginia

75.1%


Kansas ranked second (81.4%) followed by Hawaii (80.0%).

Sunbelt Struggles

On the opposite end of the spectrum, Arizona ranked lowest among the 50 states with a 62.6% favorability score. Arizona is joined by four other Sunbelt states—New Mexico, Alabama, Nevada and California—on the list of worst performers.

California

69.8%

Texas

69.7%

Wisconsin

69.0%

Maryland

68.0%

Nevada

67.8%

Indiana

67.7%

Oklahoma

66.5%

Alabama

65.8%

New Mexico

65.2%

Arizona

62.6%


Trickle Down Satisfaction

What once felt like an issue confined to one region of the country, water safety is now a nationwide issue. However, despite rising levels of concern, many customers say that their water districts are not doing an effective job getting ahead of the problem. In fact, just 2% of residential water utility customers nationwide say they recall receiving any proactive communication from their utility about PFAS contamination and steps they are taking to address the issue.

For customers to truly feel like their utility is a partner in their family’s health, utilities must find a way to not just provide cleaner drinking water, but to effectively communicate the strides they are taking to ensure the quality of that water. By doing so, water districts around the country will likely see an increase in customer satisfaction and confidence.

Find out More

This Utilities Intelligence Report was authored by Ramah Vaughn, director of utilities intelligence at JD Power. Please contact us at the numbers below to connect with Mr. Vaughn or to learn more about the underlying research.

Media Contacts

Brian Jaklitsch; East Coast; 631-584-2200; [email protected]
Geno Effler, JD Power; West Coast; 714-621-6224; [email protected]

Utilities Intelligence Report
December 2023

The nation’s electric, gas and water utilities are headed for a referendum on price, reliability, and sustainability in 2024. As we come out of a year that saw record-high prices and record-high demand, there are currently 63 electric and 52 gas rate cases pending in 37 states and the District of Columbia[1]. Meanwhile, as tensions continue to escalate around utility safety and the timetable for transition to more sustainable energy sources, all eyes are turning to utilities to see how they will navigate this volatile period and what changes they will need to make along the way.

JD Power has been tracking consumer sentiment with all aspects of utility service and delivery for the last two decades, evaluating everything from customer satisfaction with the price, reliability, and service of local utilities to opinions on sustainability and clean-air initiatives. Based on those accumulated insights, below are JD Power’s predictions for the biggest trends to watch in the year ahead.

Electric Utilities Face Consumer Backlash on Rates

Customer satisfaction with electric utilities has been trending down for the past two years as average prices rose 14.3% in 2022 and 27% through the first half of 2023. Now, as many of those same electric utilities are pursuing rate cases that add up to a combined $23.7 billion in increases nationwide, many consumers are reaching a breaking point.

That’s going to create a ripple effect of challenges for electric utilities. In fact, when tracking the correlation between utility customer satisfaction and utility profitability, JD Power has consistently found that utilities with higher overall satisfaction scores are far more likely to receive rate increases that are closer to their actual request than those with low satisfaction scores. Conversely, lower levels of customer satisfaction correlate to lower returns and lower rate case approvals. Utilities in the bottom quartile of customer satisfaction scores typically receive an approval rate that is between $2 million and $8 million lower than utilities in upper quartiles.

Utilities need to get out in front of this issue. While there’s little they can do about the costs they are incurring, there are things they can do to offset the negative sentiment their customers are feeling by ramping up communications, delivering more personalized service and making sure customers are aware of infrastructure improvements. Right now, that’s not happening at most utilities. 

Uneven EV Adoption to Define Utility Leaders and Laggards 

Nationwide, total electric vehicle (EV) market share is now at 9% as growing numbers of consumers transition away from gas-powered vehicles. At the state level, however, a stark division is emerging between the top 10 states for EV adoption, where EV adoption rates are growing steadily, and the bottom 10 states for EV adoption, where year-over-year average adoption rates are declining. This division line is creating a very different dynamic for electric utilities in different states, with some quickly emerging as EV pioneers and others being cast as the old guard.

While many electric utilities have been sitting on the sidelines of the EV evolution, some leaders have positioned themselves as EV advocates. Recognizing their critical role in delivering the infrastructure to support EV transformation and the huge potential upside that could come from widespread EV adoption, utilities such as Xcel Energy in Minneapolis and Colorado, PG&E in San Francisco and Austin Energy in Texas have launched aggressive community outreach programs that are making headway. Events like EV ride and drives and efforts to educate consumers on incentives and infrastructure improvements are helping utilities step out of the shadows and take a more active role in leading the EV transition.

Gas Confronts its Own Mortality

Despite threats to ban gas stoves and looming questions about the future of natural gas, consumers still like gas. In fact, according to JD Power data, 50% of gas utility customers have a fuel preference for natural gas in their homes, with 77% relying on natural gas for heat and 59% using it to cook.

However, with the average gas bill in America up 37% through June 2023 and price satisfaction down 49 points (on a 1,000-point scale) from a year ago, that consumer preference might not be there forever.

Gas utilities are confronting a difficult scenario in which several outside forces are conspiring against them, and most are doing very little to combat that with proactive communication, active community outreach and widespread visibility as a source of comfort and safety. Gas utilities have some major image work to do and that all starts with customer communication. Will this be the year they get on the right track? Time will tell, but so far, the outlook is not terribly promising.

Utilities Find Religion in Branding

The common bond in all of the challenges that utilities face, from high prices to concerns about sustainability, is that they can all be addressed with proactive communications efforts. In fact, in the inaugural JD Power Utility Brand Appeal Index (BAI) Study, we found that utilities with the highest brand appeal scores have average overall satisfaction scores that are more than 300 points higher than those with weak brand appeal scores. The utilities with the strongest scores rank in the top quartile in customer satisfaction and enjoy greater loyalty and advocacy. These brands also outperform on customer trust, marketing execution and company reputation metrics.

The concept of branding in the consumer-packaged goods sense of the term is a relatively foreign concept for many utilities that grew up in an era where reliable gas or electric delivery were the only priorities on the corporate mission statement. Now, as consumers increasingly look to utilities for guidance on everything from public safety to energy transition, these brands are facing an enormous opportunity to level-up their customer touchpoints and experiences to earn a premium brand value in the process.

Utilities Finally Embrace Digital

To say utilities have lagged on digital adoption is like saying it took a while for the Chicago Cubs to win their third World Series. As recently as this year, 30% of the largest utilities in the nation still did not offer a mobile app. However, as the number of customers who have signed up for an online account is now up to 71% and the number of customers signed up to receive an e-bill climbing to 62%, utilities are finally starting to realize that digital is where their customers live. This could be the year they seize that opportunity to up their digital games.

Pressure Builds on Water Utilities

Local water authorities throughout the nation have been under enormous pressure to remediate any trace of lead and copper from public water supplies as they’ve raced to comply with the Environmental Protection Agency’s (EPA) Lead and Copper Rule. The rule, which needed to be implemented between December 2021 and October 2024, introduced strict requirements for corrosion control treatment, source water treatment, lead service line inventory, lead service line replacement, public notice, monitoring for lead in schools and childcare facilities, and public education. In many cases, that meant literally going door-to-door to root out old infrastructure and test water samples.

Now, water authorities will be under pressure to deliver on the promise of clean water. One key litmus test for success will be whether customers will drink it. According to JD Power data, roughly 21% of residential water utility customers say they never drink their household tap water. However, customer satisfaction levels are significantly higher among the 36% of customers who do drink their water all the time. The proof of how well water utilities are delivering clean water and communicating that to their customers will reveal itself in the trajectory of this metric during the course of the year.

Find out More

This Utilities Intelligence Report is based on data and insights gathered across all JD Power Utilities Intelligence studies conducted over the course of 2023. It was authored by Andrew Heath, managing director; John Hazen, managing director; Chris Oberle, managing director; Adrian Chung, director; Mark Spalinger, director; Ramah Vaughn, director of Utilities Intelligence at JD Power.

Please contact us at the numbers below to connect with the team or to learn more about the underlying research.

Media Contacts

Brian Jaklitsch; East Coast; 631-584-2200; [email protected]
Geno Effler, JD Power; West Coast; 714-621-6224; [email protected] 

[1] S&P Global Market Intelligence https://www.spglobal.com/marketintelligence/en/news-insights/research/us-energy-utilities-seek-almost-24b-in-pending-rate-cases 

Utilities Intelligence Report
September 2023

Most electric utility customers in the United States acknowledge that climate change is a real phenomenon, but few believe there is much that can be done about it, according to new JD Power research into consumer awareness, support, and engagement with utility sustainability efforts. Beneath the nationwide average, however, variation exists on a state-by-state basis. 

As part of its ongoing research into customer sentiment and perceptions of electric utility sustainability initiatives in its annual Sustainability Index, JD Power tracks the key drivers that determine whether a customer believes their utility is a leader in addressing climate change. Among them, the study evaluates consumer perceptions on the severity of climate change and beliefs on what can be done to address the issue. This report takes a deep dive into those issues to identify the states where electric utility customers are most and least concerned about climate change, along with their respective levels of confidence in fixing it.

State-by-State Views on Seriousness of Climate Change

JD Power measures customer views on climate change at the state level by asking them to rank the overall seriousness of the issue on a scale of zero to four, with zero being, “There is no climate change,” and four being, “Climate change is very serious.” The analysis captures data from 48 states and the District of Columbia. Utilities in Alaska and Rhode Island did not qualify for the study. 

The national consensus is 2.54, which translates to a 52.7% majority of customers who say they believe climate change a “very serious” or “serious” threat. Utility customers in Washington, D.C., have the greatest sense of urgency about climate change, with an average score of 3.11—the only region evaluated in the study to score higher than 3. It is followed by Vermont (2.91), Washington (2.80), Hawaii (2.79), and California (2.77). 

At the other end of the spectrum, electric utility customers are least concerned about climate change in Wyoming, which posted an average score of 2.11. North Dakota (2.20), South Dakota (2.25), Mississippi (2.26) and Alabama (2.28) follow closely.

Consumer perception data

Is There a Solution?

When it comes to finding a solution for climate change, electric utility customers are growing increasingly pessimistic. Nationally, the number of customers who say they believe a lot can be done to reduce climate change has declined steadily to 37.3% this year from 40.3% in 2020. JD Power measures customer sentiment on the prospect of addressing climate change by asking how much can be done. Respondents answer on a scale of “a lot,” “some,” “very little” or “nothing.”

The data paints a particularly skeptical picture. In all areas examined, a majority believes “nothing,” “very little” or “some” can be accomplished to deal with the issue. The overall average for those choosing anything but “a lot” per state is 63.5%. In fact, most states are above 60%.

Vermont is the most optimistic state with only 53.4% of respondents believing little can be done, followed by Washington, D.C. (56.1%), Oregon (58.0%), California (58.6%), and New Hampshire (59.0%). 

Wyoming is the most pessimistic state, with 77.7% of respondents saying they feel little can be done, followed by South Dakota (71.2%), Louisiana (69.8%), West Virginia (69.3%) and Kansas (67.8%).

Utility Customers data

Moving Forward

Regardless of location, most consumers consider climate change a real issue. At the same time, there’s work to be done for increasing awareness of its severity and achieving greater buy-in about utilities ability to do something about it. Today, 82% of electric utility customers are served by a utility with a stated carbon-reduction target[1]. However, utilities, local governments, and non-governmental organizations need to make more of an investment into customer education and customer participation in energy reduction programs and other initiatives designed to reduce carbon emissions and improve utility sustainability.  Right now, just 19% of electric utility customers are even aware of those efforts, according to our research.

If they are going to become part of the solution, electric utilities need to improve customer engagement and better incentivize participation in sustainability initiatives.

While there’s a great deal of work to be done, some utilities are providing an excellent roadmap for others. AEP Energy and the Southern Company provide reports on their sustainability efforts. Portland General Electric offers a range of clean energy pricing options for both residential and business customers and has a high adoption rate. Both Southern California Edison and DTE Energy offer consumers a wide range of rebate programs. Sacramento Municipal Utility District (SMUD) and Arizona Public Service (APS) have achieved high adoption rates for their time of day/time of use programs. Charlotte, N.C.-based Duke Energy provides a comprehensive set of energy use and analysis products and services. There are others making strides as well but they are only a starting point. 

The issue of climate change is complex and there is no magic communications solution. In some cases, utilities may need to double down on their existing efforts. In other cases, some trial and error may be required to find out what works. Picking up the slack will require more time, determination, and resources than most utilities are currently devoting to their efforts around sustainability and to engaging with their customers about their clean energy goals and plans.

Find Out More

This Utilities Intelligence Report is based on responses from 70,486 utility customers nationwide that were fielded from June 2022 through May 2023. It was authored by Andrew Heath, Ph.D., managing director of utilities intelligence at JD Power. Please contact us at the numbers below to connect with Dr. Heath or to learn more about the underlying research.

Media Contacts

Brian Jaklitsch; East Coast; 631-584-2200; [email protected]
Geno Effler, JD Power; West Coast; 714-621-6224; [email protected] 


[1] SEPA Utility Carbon-Reduction Tracker™. Smart Electric Power Alliance (SEPA). Retrieved July 21, 2023, from https://sepapower.org/utility-transformation-challenge/utility-carbon-reduction-tracker/ 

Utilities Intelligence Report
June 2023

As Americans Focus on Water Quality, These States Boast the Best

Water season has arrived. Whether it’s a condensation-soaked glass on a hot day, a glistening pool filled to the brim, or a cleansing shower after hours at the beach, summer is a time when Americans interact the most with the water from their taps.

As the United States approaches Summer 2023, the quality of drinking water has become a hot topic. Years after water crises in various U.S. cities, federal regulators are now taking unprecedented action in cracking down on PFAS chemicals to ensure safer, higher quality water for residents.

Of course, some states are further ahead in that fight than others. And even though some have to contend with a number of factors – from varying availability of natural resources to different water sources – many utilities are working hard to ensure quality water that is delivered reliably and billed easily, all from a utility that communicates well with its customers.

Methodology

To determine which states have the best tap water, JD Power analyzed feedback from customers of water utilities regarding their experiences in six factors: quality and reliability; price; conservation; billing and payment; communications; and customer service. Of those six factors, this analysis focuses on customers’ feedback on which states have the best quality and reliability. The study tracked customers in all 50 states and the District of Columbia. To be eligible to be ranked, states represented must have a water utility that serves a minimum of 400,000 residential customers as well as a minimum 100 survey respondents.

In the study, the relative importance of each attribute on overall quality and reliability is derived using JD Power proprietary index methodology. These importance weights are then applied to customer ratings to create a score that ranges from 100 to 1,000 points.

The Blue (Water?) State

After analyzing the data, Kentucky ranks highest with a score of 768 (on a 1,000-point scale). A hallmark of the Blue Grass State’s success: Kentucky’s performance at the tap was so good that Louisville Water was actually able to trademark its tap water (called Louisville Pure Tap®), a feat some states would not dare to attempt.

Kentucky

808

Washington

808

New York

801

Oregon

796

Kansas

795

Massachusetts

793

Connecticut

789

Minnesota

788

Virginia

785

Hawaii

782

Washington State finishes in a virtual tie with Kentucky, as residents made note of their willingness to drink tap water. More than half (55%) of Washington State residents said they always drink tap water, which ranks among the highest in the country. New York places third, thanks in large part to recent infrastructure improvements made throughout the Empire State.

Bottom of the Barrel

Unfortunately, not every state’s utility is hitting those high marks when it comes to overall satisfaction with public water supplies. While most of the lower-ranked states were close to the meaty part of the satisfaction curve, there is a precipitous drop toward the bottom of the list. Alabama, which had an quality and reliability score of 701, was the lowest-ranking state in the analysis, struggling in virtually every category evaluated.

Indiana

756

Arizona

750

Mississippi

750

Ohio

748

Pennsylvania

748

Texas

737

New Mexico

731

Oklahoma

726

Maryland

721

Alabama

701

 Glass Half Full

As more Americans have become dedicated to conservation efforts, there has been renewed customer interest in the quality of the water in the home. For example, refillable water bottles have become a fixture in homes and offices around the country, but those are only as good as the water that goes in them. Even with the help of filters from the likes of Britta and ZeroWater, customers must know that their utility is working for them to provide as pure of a water supply as they can, while offering clear communication, billing, and reliable overall service.

There are plenty of states that are achieving those standards, but some remain woefully behind. And with regulators starting to shine a microscope on water quality, now has never been a better time for utilities to ask the tough questions about how they can improve and rise to the occasion to deliver a better product.

Find Out More

This Utilities Intelligence Report is based on responses from 36,833 residential water utility customers nationwide and was fielded from June 2022 through March 2023. It was authored by Ramah Vaughn, director of utilities intelligence at JD Power. Please contact us at the numbers below to connect with Mr. Vaughn or to learn more about the underlying research.


Media Contacts

Brian Jaklitsch; East Coast; 631-584-2200; [email protected]
Geno Effler, JD Power; West Coast; 714-621-6224; [email protected]

E-Vision Intelligence Report
April 2023

EV Divide Grows in U.S. as More New-Vehicle Shoppers Dig in Their Heels on Internal Combustion

Key Findings

  • EV Holdouts Become More Resolute: Despite recent growth in electric vehicle (EV) market share, the percentage of U.S. consumers who say they are “very unlikely” to consider an EV for their next vehicle purchase has been growing steadily for the past three months, reaching 21% in March.
  • Charging Infrastructure and Purchase Price Remain Biggest Barriers to Adoption: The top five reasons vehicle shoppers give for not considering an EV are all focused on public charging infrastructure and vehicle pricing.
  • Ambiguity on Incentives Creates Challenges: New criteria introduced by the Internal Revenue Service (IRS), which limit tax credits on the sale of new EVs based on details of the chemical composition of their batteries, will reduce the affordability of EVs, potentially limiting future sales.

Executive Summary

It’s not all sunshine smooth sailing on the road to the EV future. While the long-term trend in EV market share has grown significantly from 2.6% of all new-vehicle sales in February 2020 to 8.5% in February 2023, sales hit a speed bump in March, with monthly market share falling to 7.3%. Although some month-to-month volatility is to be expected, a closer look at the barriers to EV adoption shows that many new vehicle shoppers are becoming more adamant about their decision to not consider an EV for their next purchase.

According to new data from JD Power, this steady increase in the percentage of consumers who say they are “very unlikely” to consider an EV for their next vehicle purchase reflects persistent concerns about charging infrastructure and vehicle pricing.

This E-Vision Intelligence Report dives into key data points trending in each monthly EV Index update, along with other data points gathered from JD Power studies and pulse surveys, to spotlight emerging trends and important shifts in EV consumer sentiment.

Rise of the EV Holdouts

Top-line metrics on overall EV market share, availability and affordability have been on a long-term upward trend, but beneath those headline numbers we are starting to see some consumer behaviors that suggest a possible bifurcation of the automotive marketplace. Notably, when it comes to the percentage of new-vehicle shoppers who say they are “very likely” and “very unlikely” to consider an EV, the number of EV holdouts is growing more. As of this month’s report, 21% of new-vehicle shoppers say they are “very unlikely” to consider an EV, up from 18.9% in February and 17.8% in January. Meanwhile, the percentage of auto shoppers who say they are “very likely” to consider an EV is 26.9% and has been largely flat for the past three months.

rejection chart

Charging Infrastructure, Price and Demographics All Play a Role

Digging deeper into the primary barriers to EV purchase consideration, we find remarkable stability in the top reasons consumers provide for sticking with internal combustion engine (ICE) vehicles. Lack of public charging infrastructure and price have been the top two concerns for the past 10 months, along with related issues involving range anxiety, time required to charge and power outage and grid concerns. Recent high profile infrastructure initiatives, such as Walmart’s plan to dramatically expand its charging network and Tesla’s announcement that would open some of its supercharger network to non-Tesla vehicles have apparently had little effect on these consumer concerns, at least so far.

graph2


Demographics are also playing a role in these results. While it may not be surprising that the majority of Boomers[1] and Pre-Boomers aren’t considering EVs, fully one-third (33%) of Gen Z shoppers—the future of the marketplace—say they’re “somewhat unlikely” or “very unlikely.” It is clear in the data that price and charging infrastructure are significant obstacles for a wide spectrum of potential customers.

New Tax Credit Rules Create Confusion

Consumer interest in EVs is heavily swayed by price, with our data consistently showing a clear correlation between consumer demand and government incentives, lease deals and manufacturer price cuts. Recently, that relationship has driven a surge in interest in vehicles like the Ford Mustang Mach-E and Tesla Model Y, which were reclassified as SUVs and became eligible for $7,500 federal tax credits under the Inflation Reduction Act (IRA).

In mid-April, the IRS and the U.S. Treasury Department issued new guidance on specific vehicle requirements that need to be met before EVs can be eligible for these tax credits. These include the location where the vehicle is assembled and details on the sourcing of critical minerals used in the construction of vehicle batteries. On this last point, batteries and components must originate in the United States or come from countries with which there is a free trade agreement for the vehicle to qualify. This new hurdle will affect the affordability of several EV models, while also likely introducing more confusion among buyers. While we cannot yet forecast the exact effect this new guidance will have on EV adoption, our data suggest that higher prices will negatively affect EV sales.

graph3


Methodology

This JD Power E-Vision Intelligence Report is based on data and insights from the JD Power EV Index and the JD Power EV Consideration pulse survey. The JD Power EV Index is an analytics tool to benchmark the growing EV market in the United States. It tracks millions of data points aggregated into six categories—interest, availability, adoption, affordability, infrastructure and experience—to evaluate the progress to parity of EVs with ICE vehicles in the U.S. Each month, JD Power’s electric vehicle practice will analyze these data points, and others to spotlight emerging trends and important shifts in consumer sentiment that are helping to define the fast-moving EV marketplace.

chart four


Find out More

This report was authored by Elizabeth Krear, vice president, electric vehicle practice; Brent Gruber, executive director, electric vehicle practice; Stewart Stropp, executive director, electric vehicle practice; Kristen Richter, senior manager, electric vehicle practice; and Karlo Vukobratovic, analyst, electric vehicle practice, JD Power. The JD Power E-Vision initiative is a company-wide program focused on maximizing JD Power industry-leading EV data, analytics, insights and solutions. Please contact us at the numbers below to connect with the authors or to learn more about the underlying research.


Media Contacts

Shane Smith; East Coast; 424-903-3665; [email protected]

Geno Effler, JD Power; West Coast; 714-621-6224; [email protected]


[1] JD Power defines generational groups as Pre-Boomers (born before 1946); Boomers (1946-1964); Gen X (1965-1976); Gen Y (1977-1994); and Gen Z (1995-2004). Millennials (1982-1994) are a subset of Gen Y.

Utilities Intelligence Report
March 2023

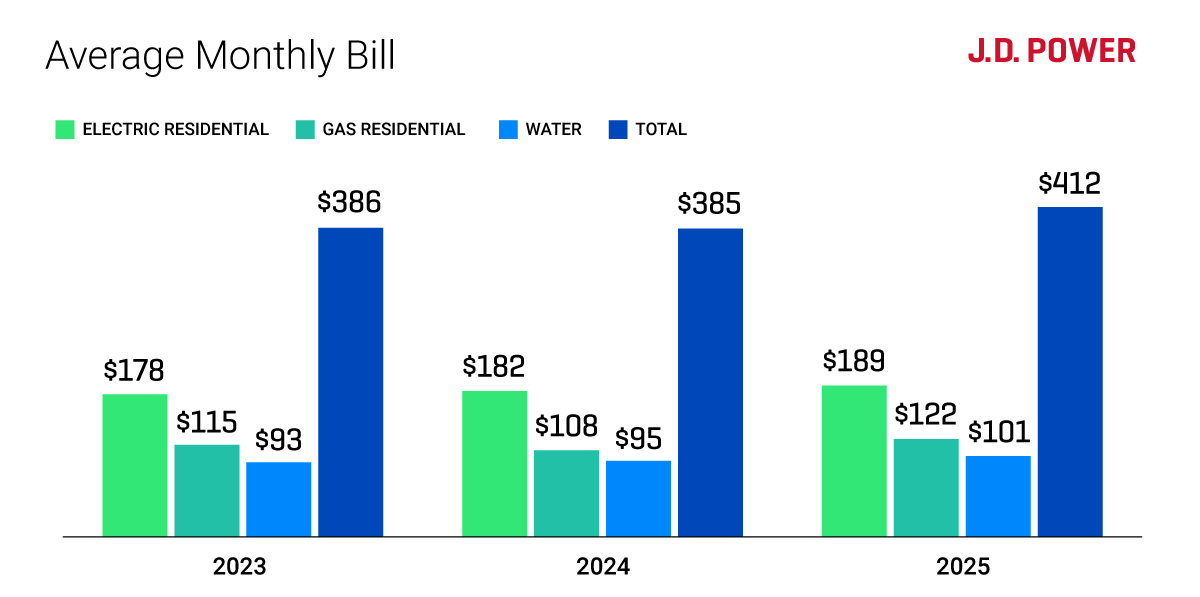
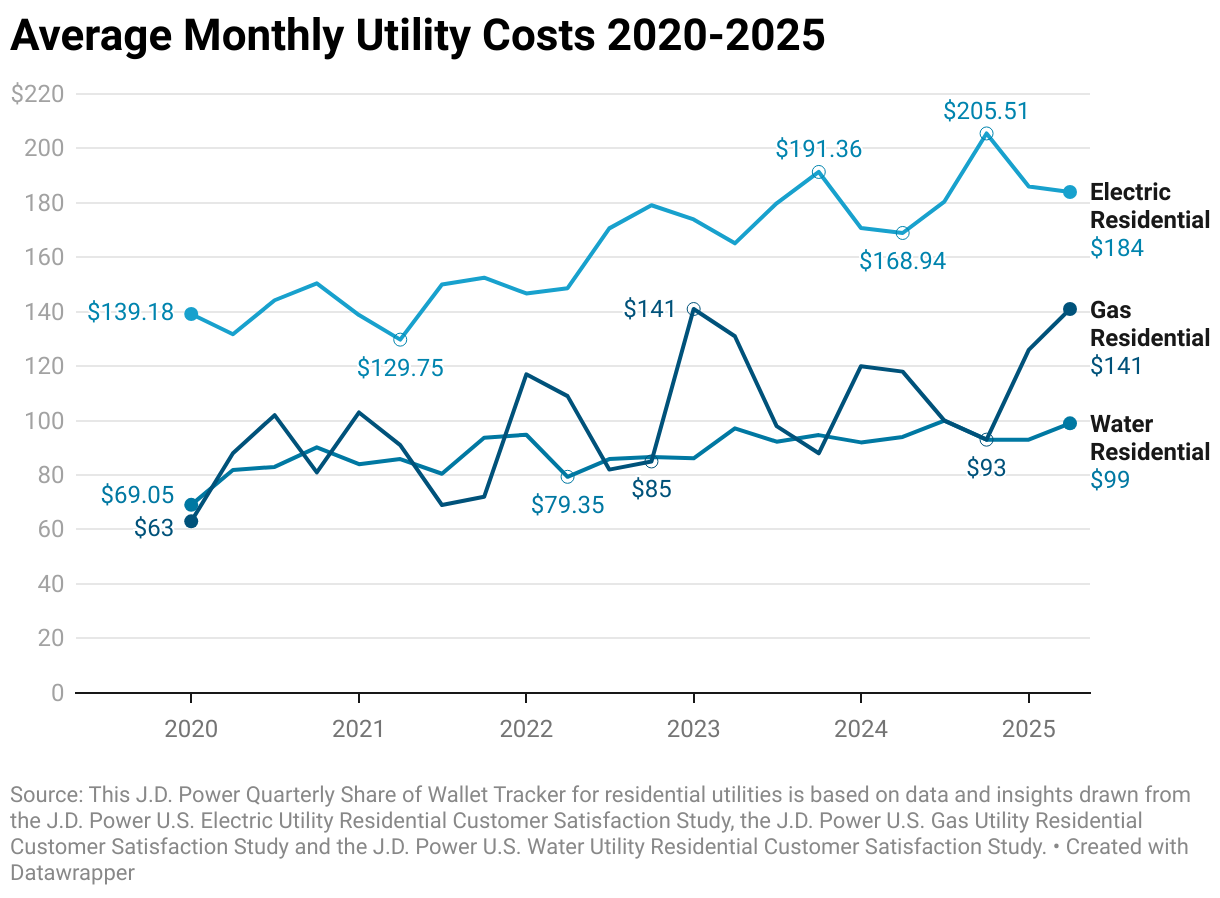
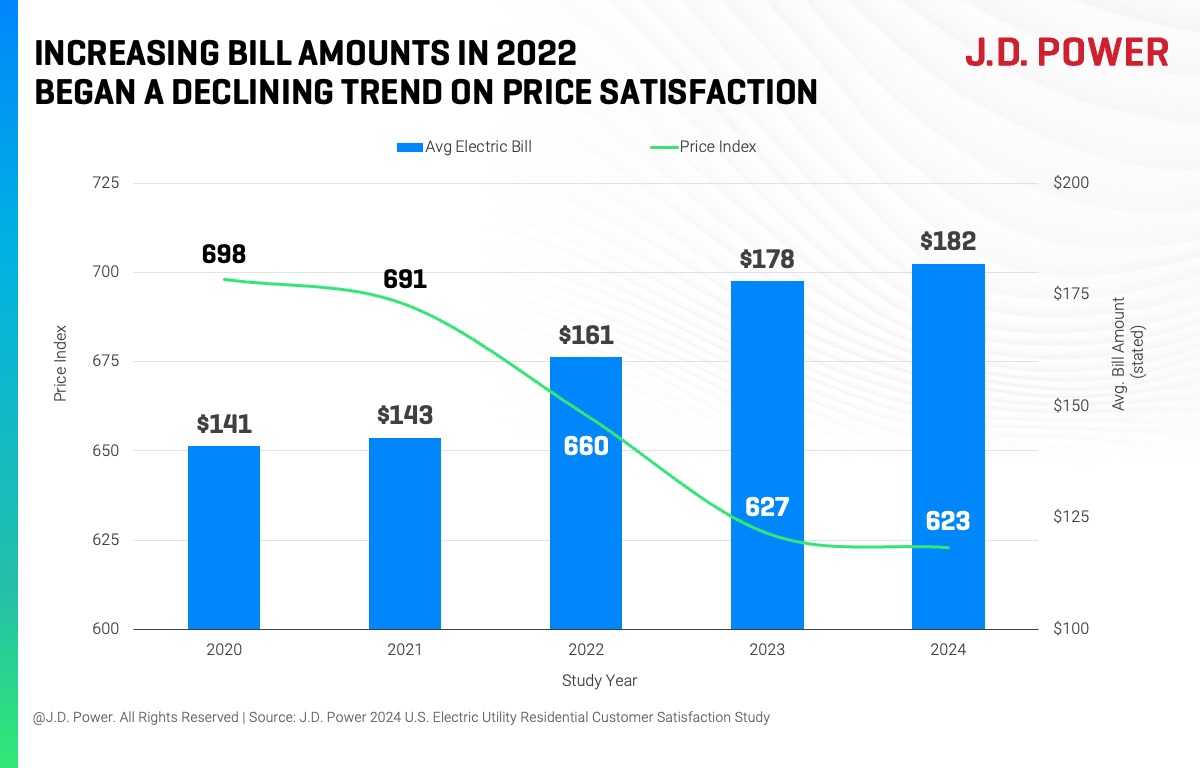
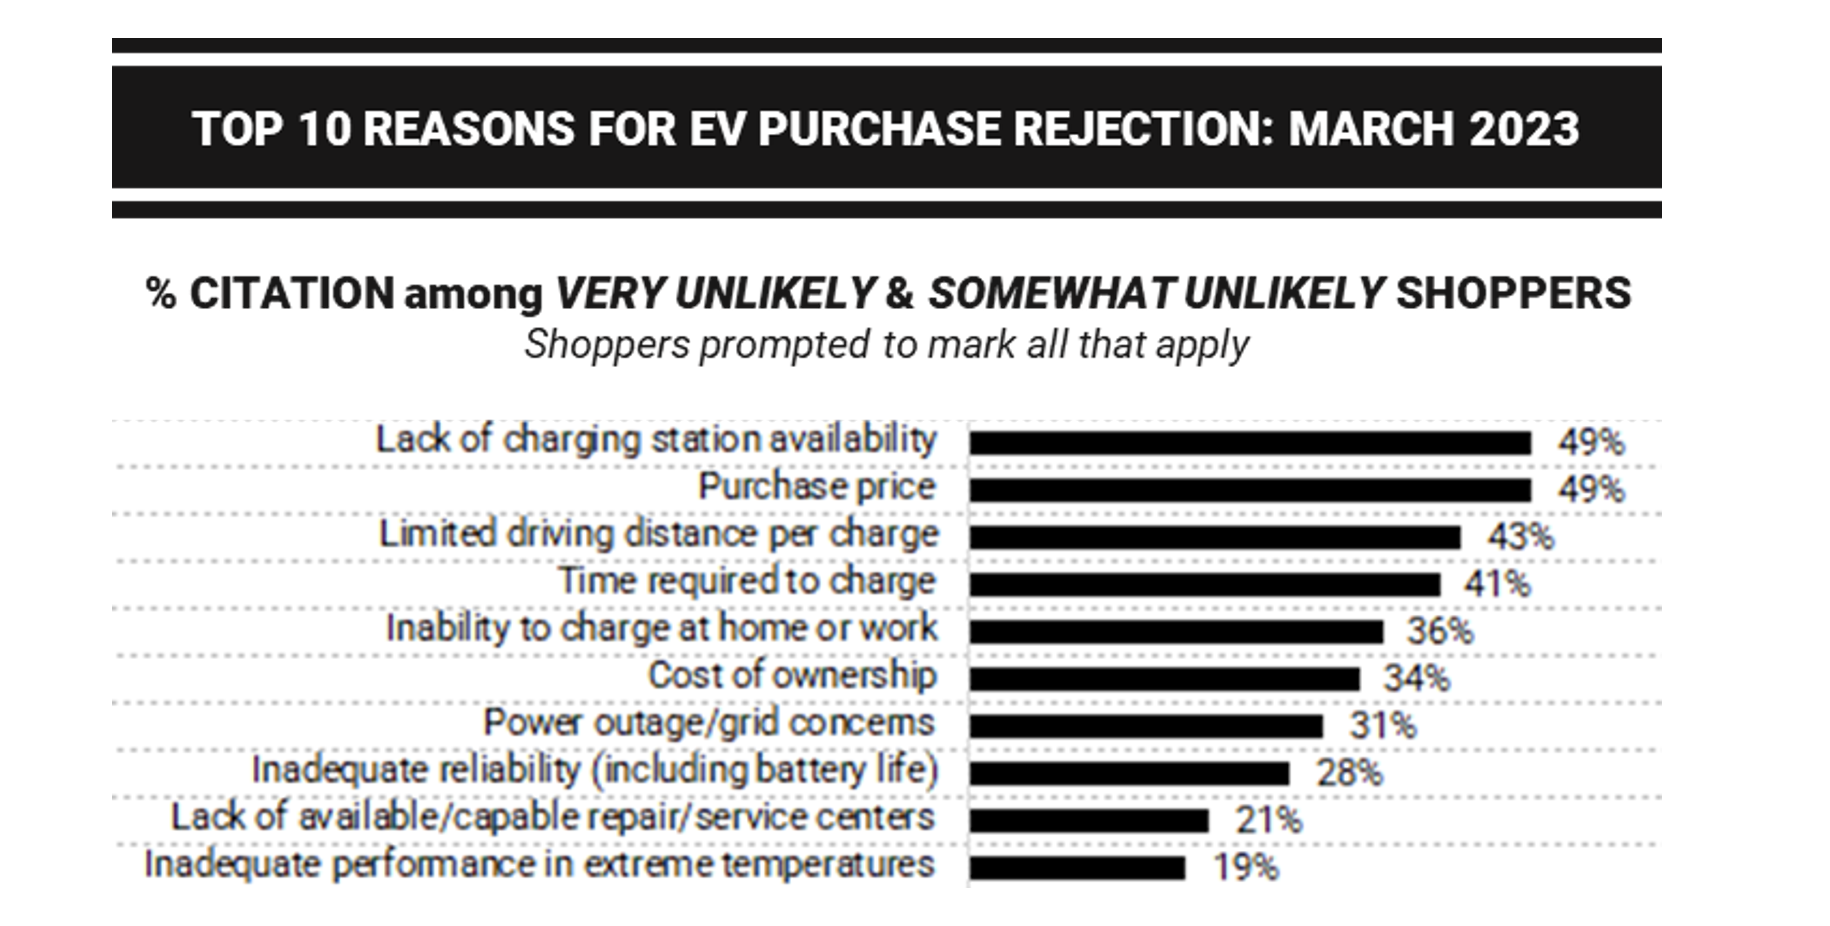
Electricity bills in the United States rose 13.1% on average in 2022, higher than the overall rate of inflation. Concurrent with this trend, utilities have introduced aggressive carbon reduction goals and sustainability initiatives that rely on customers reducing their energy consumption through a combination of time-of-use rates, energy-saving appliance rebate programs and more.

In fact, 81% of electric utility customers are now served by a utility with a stated carbon reduction target. Despite this decade-long push to change emissions by spurring customer participation in these programs, many customers are completely unaware that energy conservation and sustainability programs even exist. Is the recent run-up in electricity prices proving the catalyst to finally change consumer behavior?

According to the latest JD Power data, even record high energy prices haven’t been enough to spur a significant increase in awareness of energy conservation and sustainability initiatives. However, a handful of utilities are starting to see their investments in sustainability pay off in the form of improved customer satisfaction and increased perceptions of affordability among customers. While these examples are in the minority, they offer a playbook for strategies that are working when it comes to consumer awareness of utility sustainability initiatives.

Ultimately, our research finds that utilities with a clearly stated sustainability goal, a concerted plan to achieve that goal and widespread support for that plan among customers are slowly changing customer behaviors and perceptions. These examples are rare, however, and the vast majority of electric utilities and utility customers are largely in the dark on sustainability and energy conservation initiatives – even as record high prices are hitting their wallets each month. Without a dramatic change of course, these utilities will struggle to meet their sustainability targets.

RECORD HIGH RESIDENTIAL ELECTRICITY PRICES DECOUPLED FROM SUSTAINABILITY

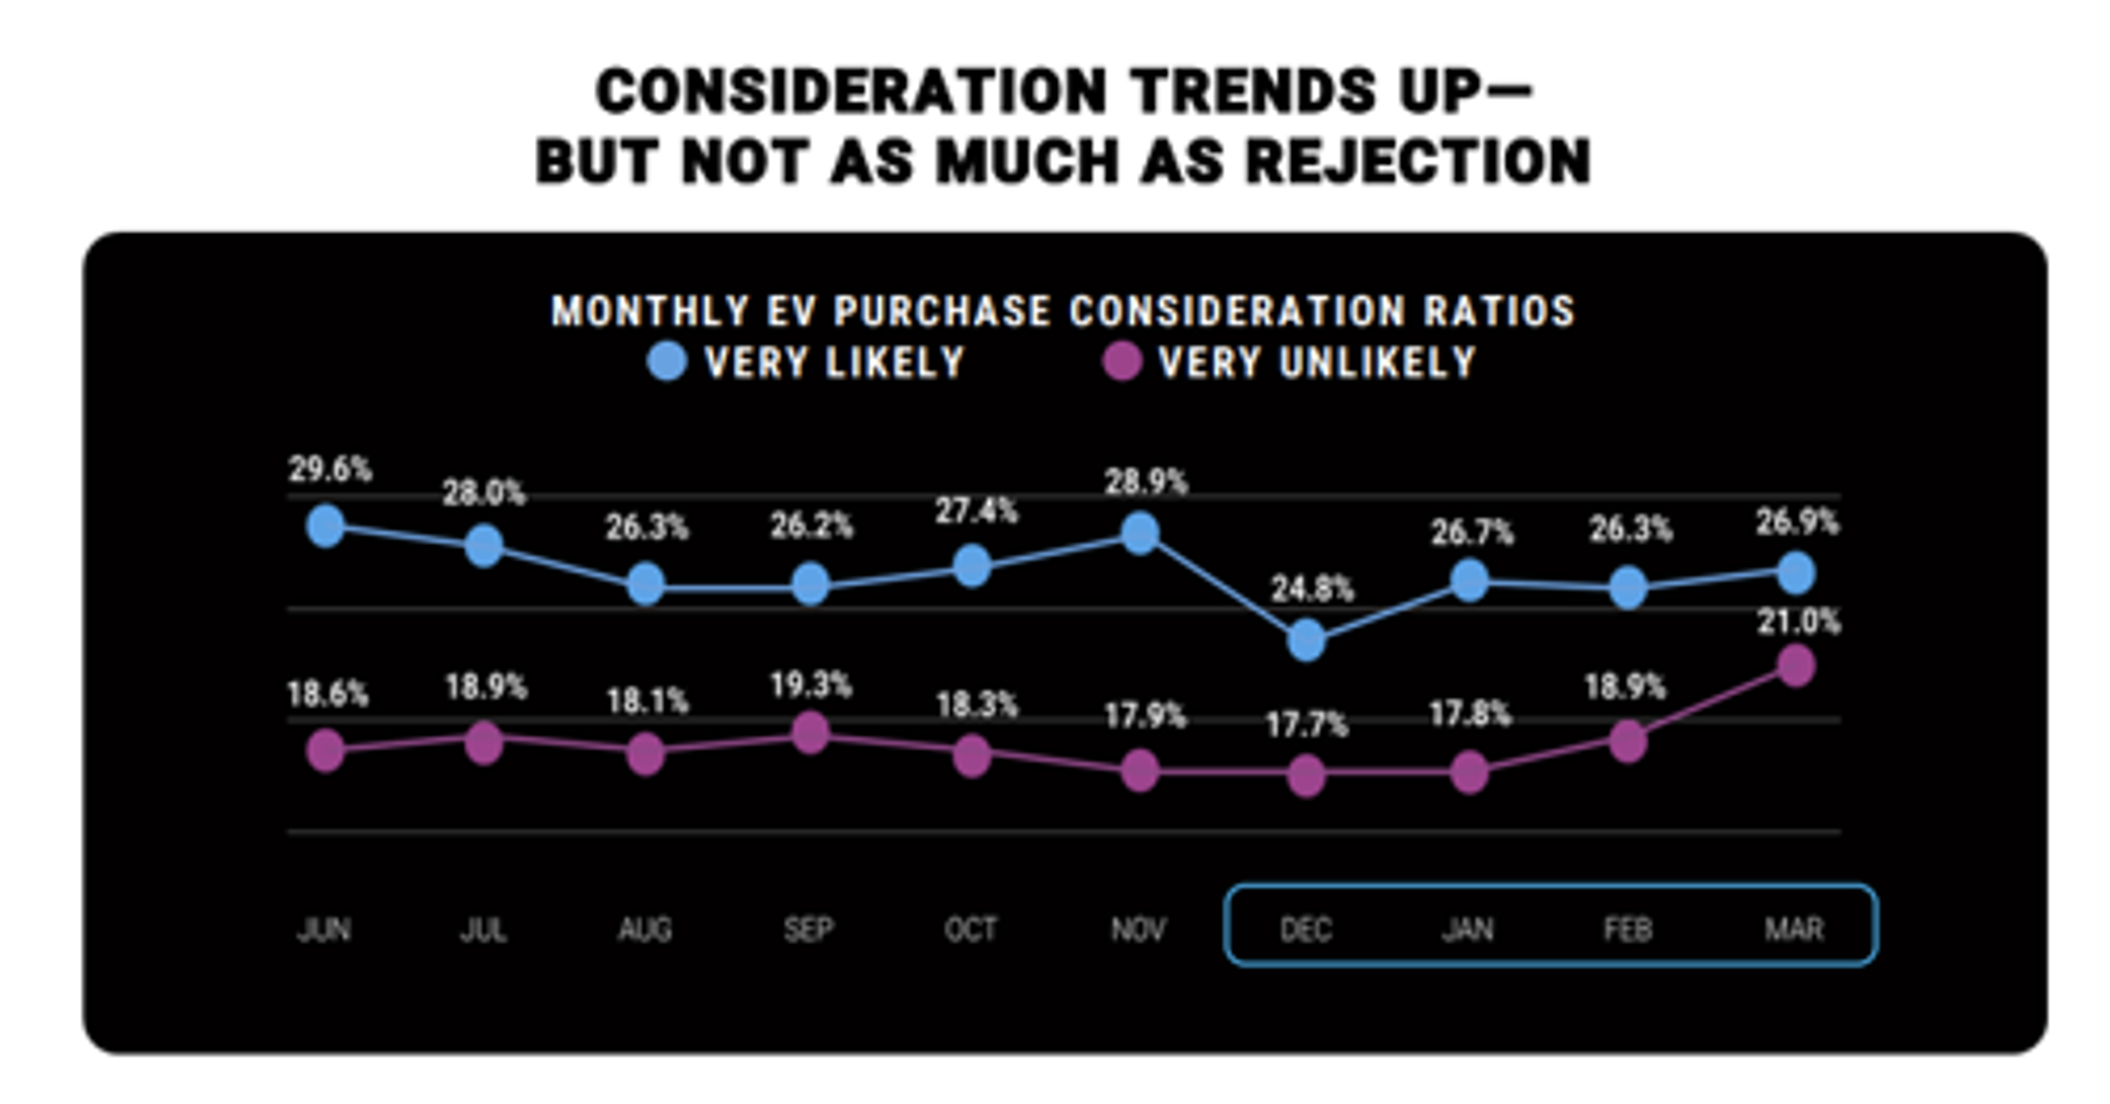
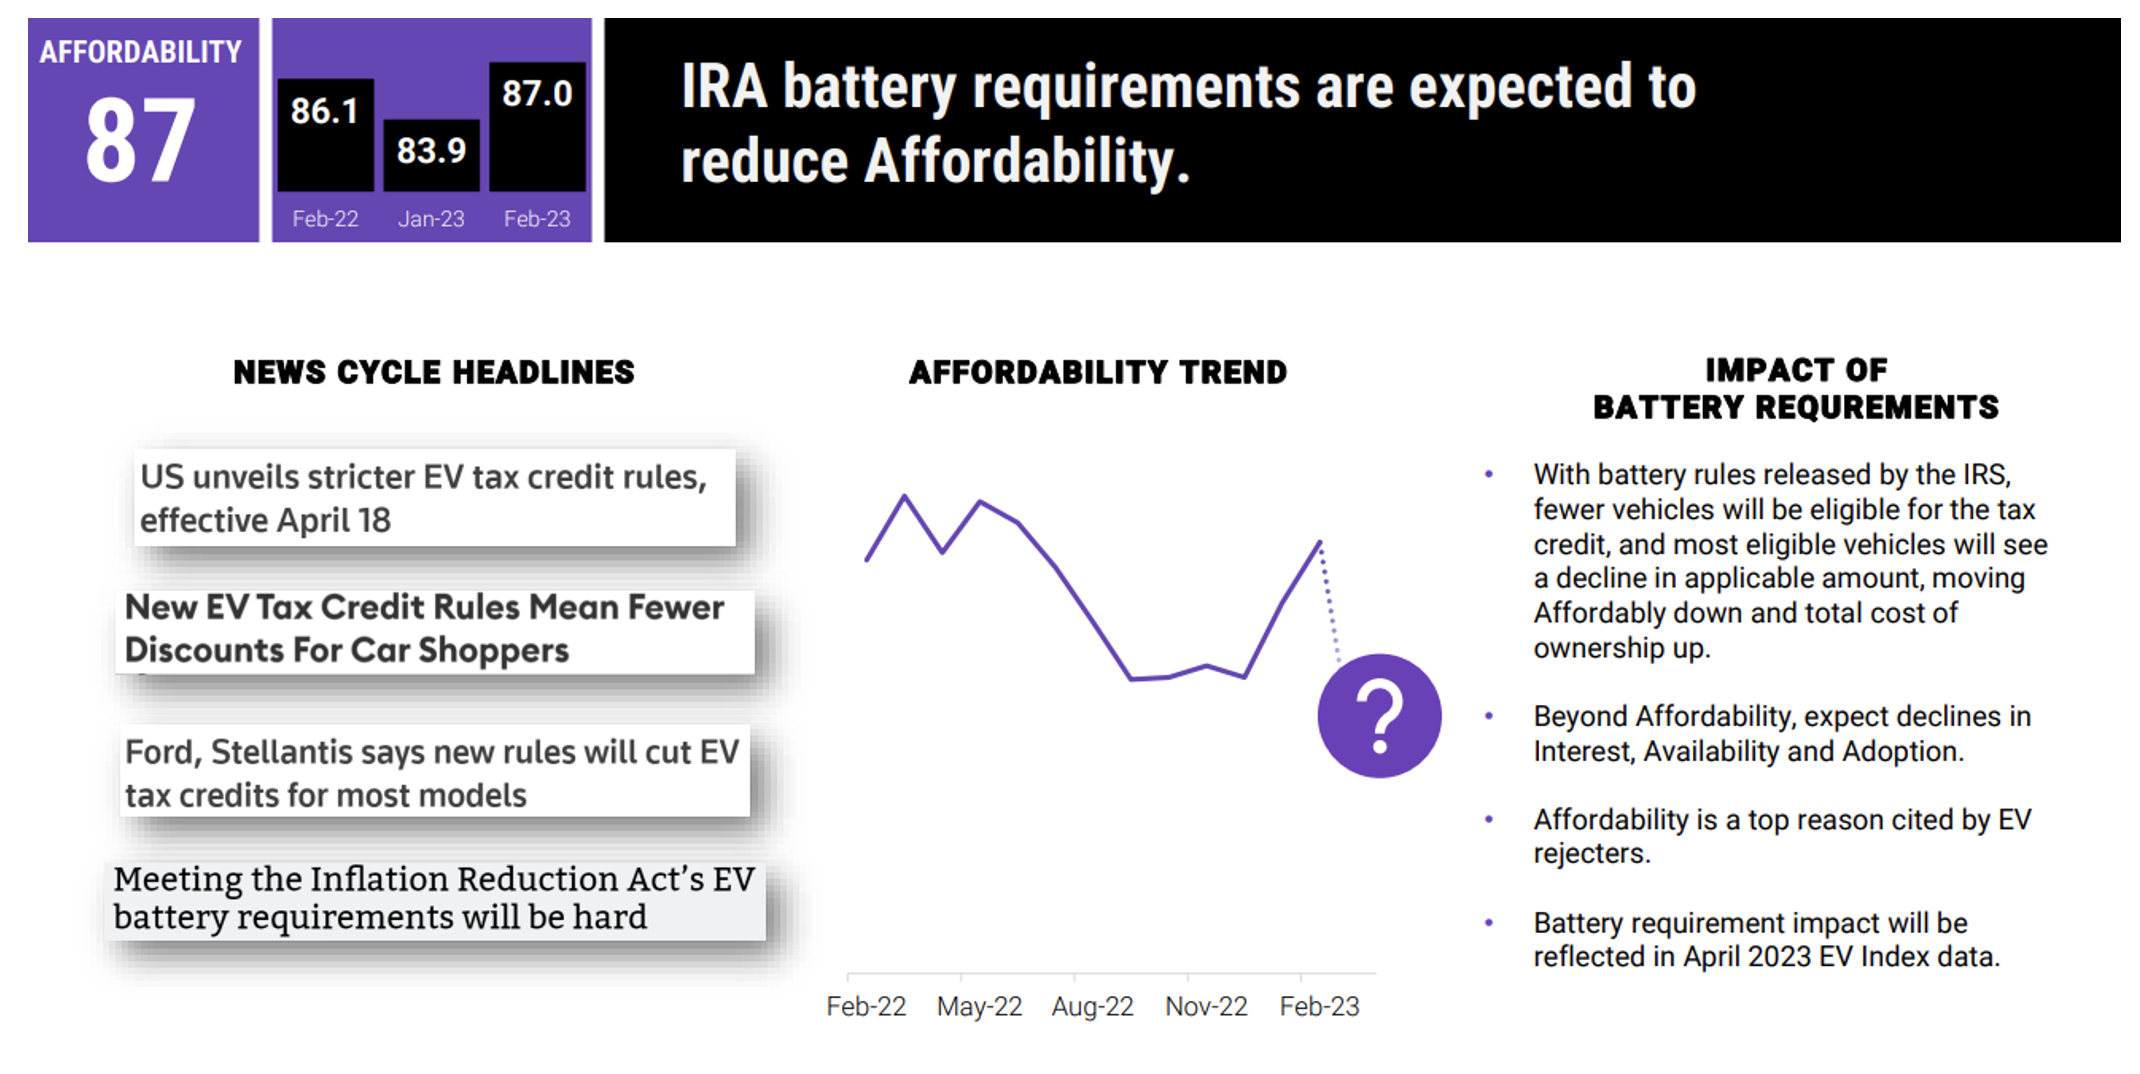
Customers in the U.S. are notoriously sensitive to changes in commodity prices and those changes often influence behavior. We see this trend prominently in our automotive data set, where incremental movements in the price per gallon of gas are directly correlated with consumer interest in electric vehicles, and, conversely how those rising fuel prices negatively affect the sale of large, gas-powered SUVs. The same cannot be said, however, for the correlation between rising electricity prices and consumer participation in utility energy management programs.

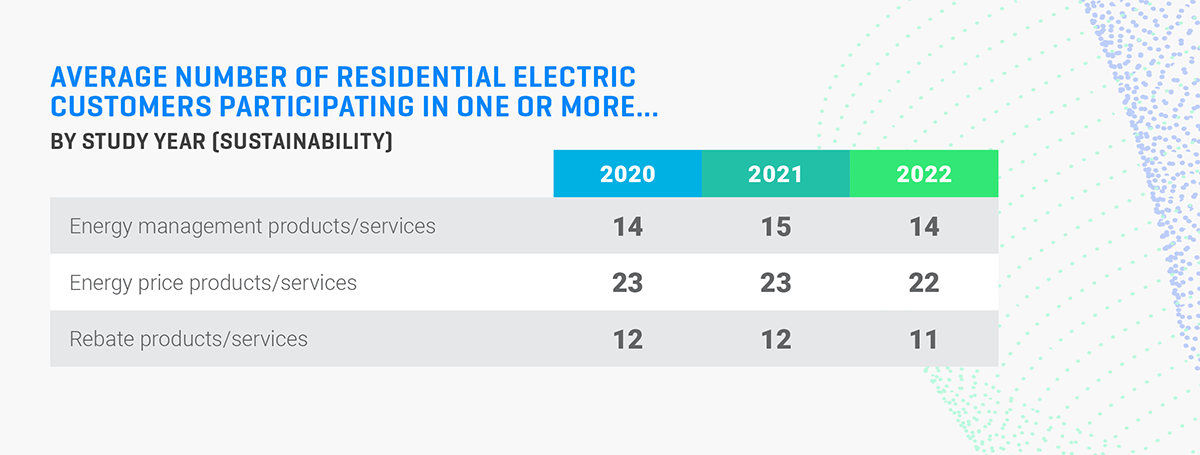
In fact, according to our data, just 14% of residential electric utility customers participated in one or more energy management programs offered by their utilities in 2022, a rate that was unchanged from 2020. Perhaps even more surprising, the number of residential electric customers participating in one or more price reduction or rebate programs, such as those offering discounts for using energy-efficient appliances, actually declined one percentage point between 2020 and 2022.

Average Number of Residential Electric Customers Participating in one or more...

PERSISTENTLY LOW LEVELS OF CUSTOMER AWARENESS

The likely driver of these low participation rates is lack of customer awareness. Unlike the auto industry, which blankets the airwaves, news headlines and social media feeds with special offers on hybrids and EVs, the moment the national average gas price crests the $3.25 per gallon mark, the nation’s electric utilities have struggled to build awareness for consumer participation in their energy conservation programs.

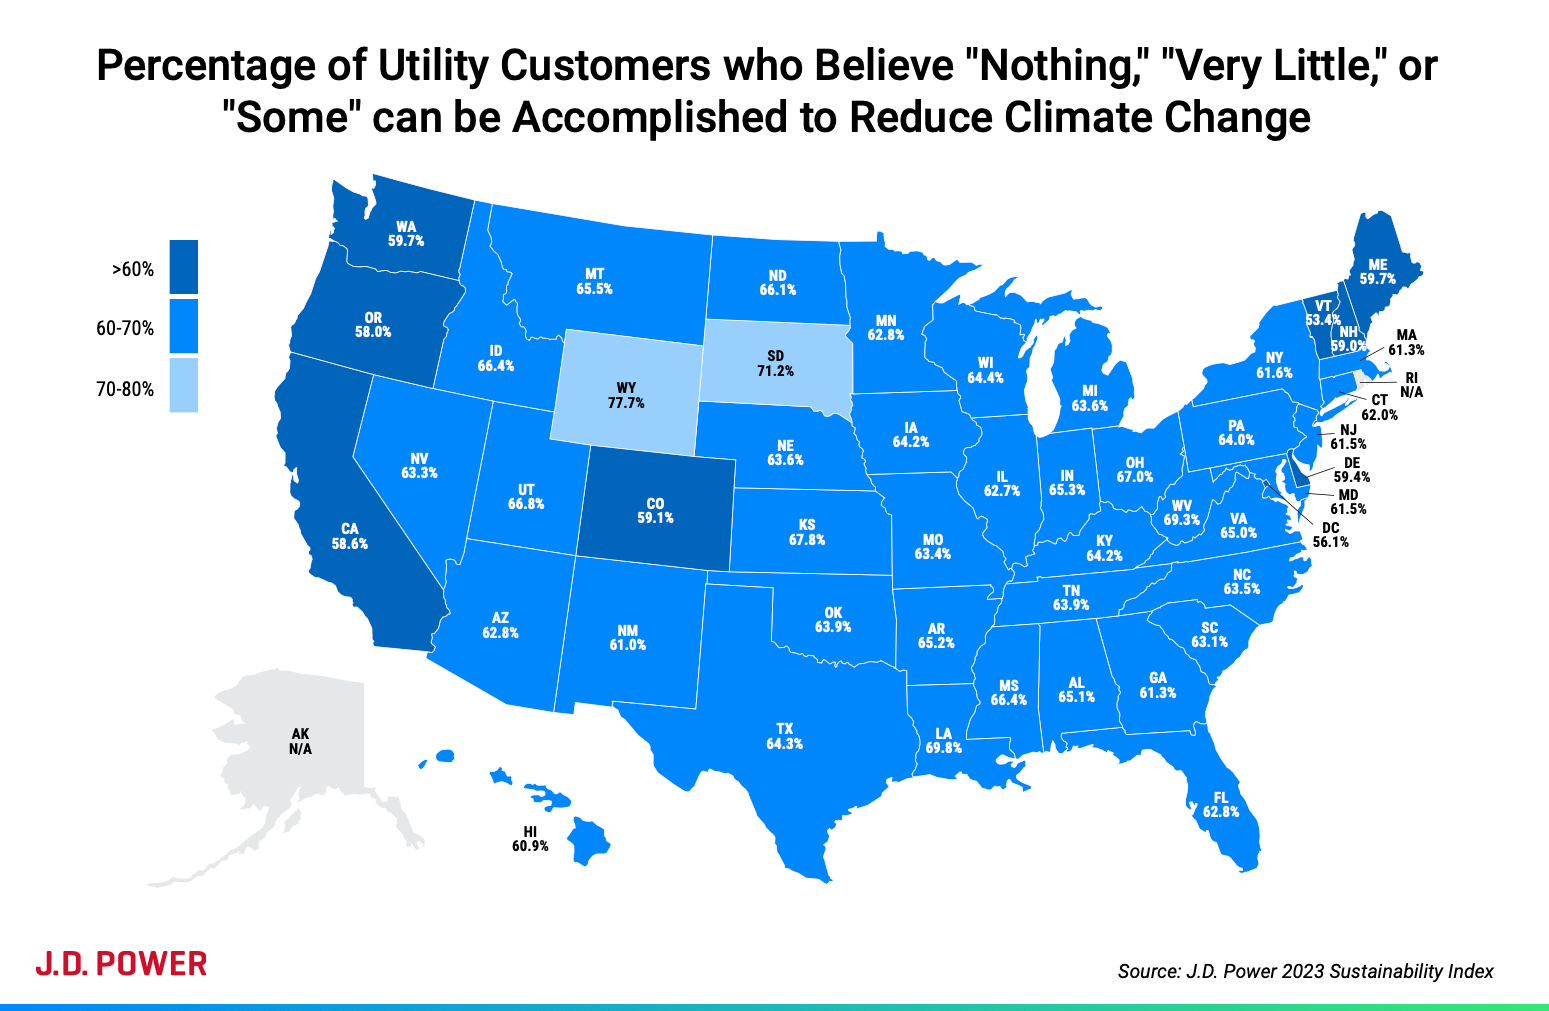
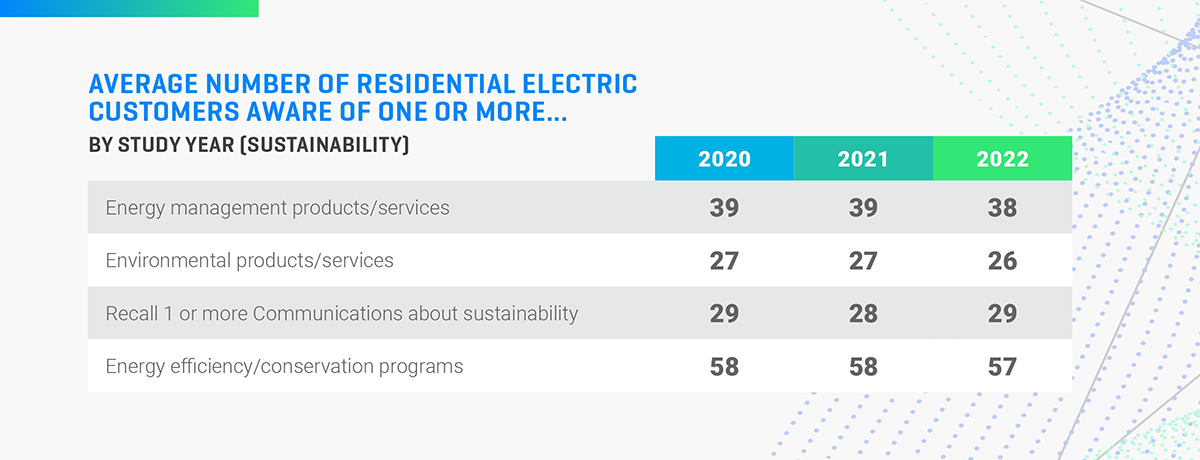
According to our data, just 38% of residential electric utility customers were aware of one or more energy management product or service and just 26% were aware of one or more environmental product or service through the end of 2022. Both numbers are down one percentage point from 2020. Likewise, consumer awareness for utility efforts to increase the use of clean energy and recall of any utility communications about sustainability have been flat at 28% and 29%, respectively, for the past three years.

Average Number of Residential Electric Customers Aware of One or More…

WHAT WILL IT TAKE TO FORCE A BEHAVIOR CHANGE?

While very few U.S. electric utilities have the customer awareness and support they will need to meet their stated carbon reduction targets, some pioneers have taken a more aggressive approach to getting customers to change their behaviors by introducing time of use (ToU) rates. This pricing scheme, which sets different rates for electricity use based on hours of peak demand during, is meant to encourage use of high-energy consuming tasks—such as dishwasher and washer and dryer use—outside of the hours of peak demand on the power grid. In California, for example, the Public Utility Commission (CPUC) has mandated that all investor-owned utilities operating in the state adopt new ToU rate structures.

The California program was first piloted in 2016 and we’ve been tracking customer experience with it since 2018. Overall, we’ve found that customers who proactively chose to be part of a ToU have had significantly higher levels of customer satisfaction and improved perception of affordability. However, when customers were mandated to participate in these programs, satisfaction scores plummeted. Verbatim responses from consumers who were forced into these programs ranged from simple gripes like: “Lose the time-of-day usage,” to more urgent pleas: “The new increased rate for electric use from 4 to 9 p.m. has raised our bill significantly even though we do much to conserve.”

Switched Rate Plan California Only

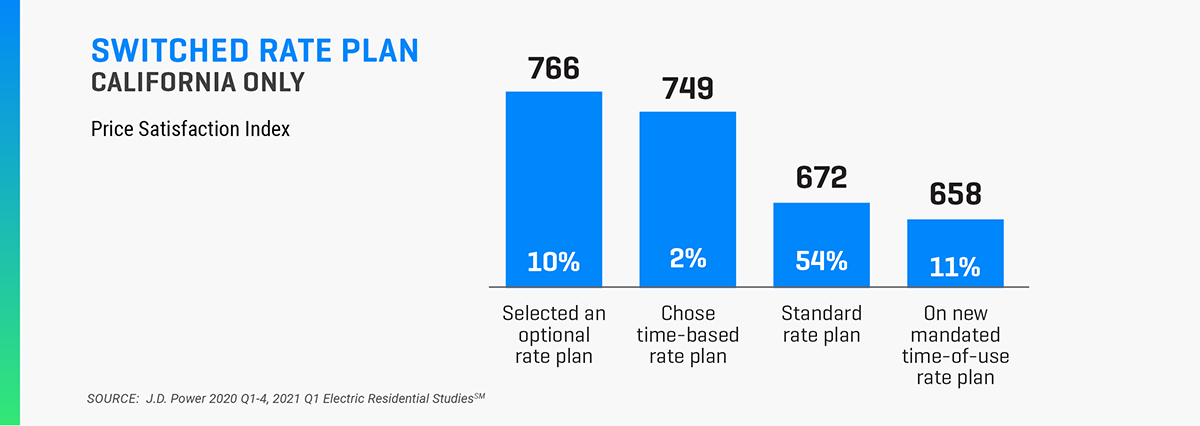
Source: JD Power 2020 Q1-4, 2021 Q1 Electric Residential StudiesSM

Among the few electric utilities that have been able to successfully manage this transition, the Sacramento Municipal Utility District (SMUD) has been able to burnish its image with its customers by carefully communicating its goal, putting a defined plan behind it and slowly building customer support. Throughout the first three years of the multi-year roll-out of its ToU initiative (or “Time of Day” as it’s referred to in Sacramento)—even as customers’ average bills have increased—customer perceptions of affordability have held strong.

Chart 4

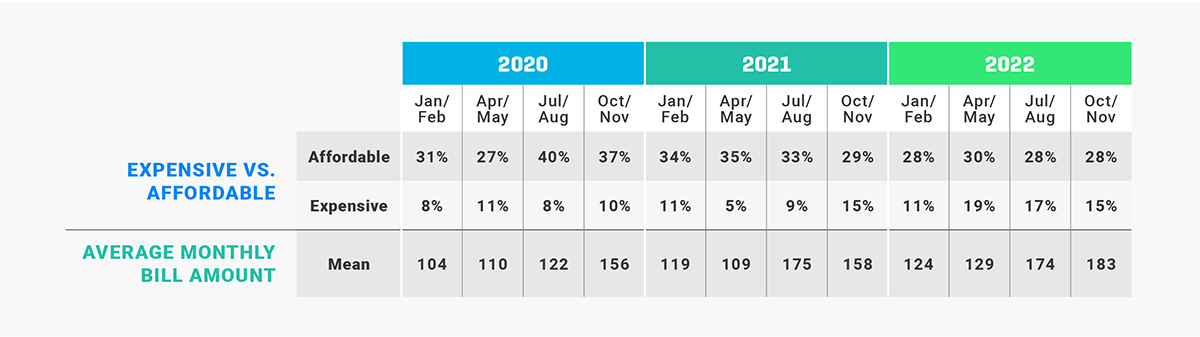
More recently, however, as energy prices have started to climb nationwide, even SMUD, which has been a pioneer in sustainability has started to see customer perceptions of affordability decline. Between 2021 and 2022, the percentage of SMUD customers characterizing the utility’s pricing as “affordable” has declined from 35% to 28%.

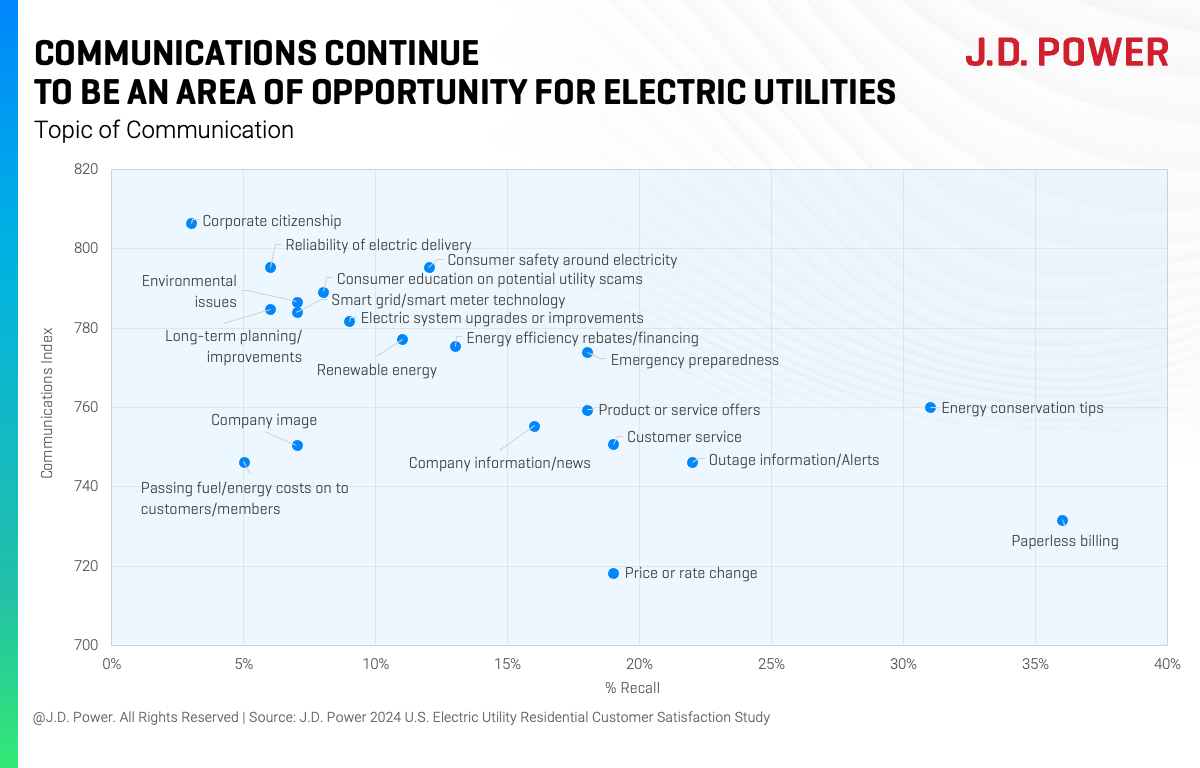
COMMUNICATION IS THE MISSING LINK

If energy conservation and transition to more sustainable alternatives are the goals for electric utilities, sky-high rates should be the catalyst to driving the consumer behavior changes needed to finally meet those goals. But that’s not happening today, and it’s largely a function of communication. Right now, even the best-performing utilities are not where they need to be in terms of customer engagement, awareness and support for sustainability initiatives. They need to get serious about customer communication to drive participation in these programs and, eventually, make a clear link in the customer’s eyes between sustainability and affordability.

MAKE IT EASY

Awareness is a big problem, but, even in cases where customers are aware of sustainability and energy conservation initiatives, they are often ignored. Far too often, products and services that are required to meet clean energy goals are designed to make things easy for the utility, not necessarily easy for the consumer. For example, many rebate programs can be difficult to find on utility websites and it is not always clear which appliances qualify or what information needs to be provided.

It’s no surprise that customers then struggle to understand the benefits of these programs, and how they can play a role in helping to use more clean energy and helping their electric utility meets its sustainability goals.


FIND OUT MORE

This Utilities Intelligence Report is based on data from the 2020, 2021 and 2022 editions of the JD Power 2022 Sustainability Index and the JD Power Special Report on the Impact of Time of Use Rates.

It was authored by Andrew Heath, managing director, utilities intelligence at JD Power. Please contact us at the numbers below to connect with Dr. Heath or to learn more about the underlying research.

Download a copy of the report here


MEDIA CONTACTS

Brian Jaklitsch – East Coast

631-584-2200

[email protected]

Geno Effler, JD Power – West Coast

714-621-6224

[email protected]

jdpower.com/business/utilities


JD Power does not guarantee the accuracy, adequacy, or completeness of any information contained in this publication and is not responsible for any errors or omissions or for the results obtained from use of such information. Advertising claims cannot be based on information published in this publication. Reproduction of any material contained in this publication, including photocopying in part or in whole, is prohibited without the express written permission of JD Power. Any material quoted from this publication must be attributed to JD Power.

© 2023 JD Power. All Rights Reserved.