The third-generation Nissan Leaf takes a bold direction. Repurposed as a crossover with coupé styling, can this new philosophy appeal to buyers? Autovista24 special content editor Phil Curry reviews the model alongside regional experts.
The Nissan Leaf has already carved out a legacy in Europe’s automotive market. As one of the first mass-produced battery-electric vehicles (BEVs), it became a launchpad and an early symbol for the technology.
However, with increasing competition, the Japanese carmaker has taken a new direction, hoping to carve out a new legacy. As a result, the latest Nissan Leaf is a far cry from the one that landed in the C-segment in 2010.
No longer a simple hatchback, the BEV has been repositioned as a crossover with a coupé-like body design. This re-imagining has helped to refresh the model’s appeal, moving it into a world of sleek and modern styling.
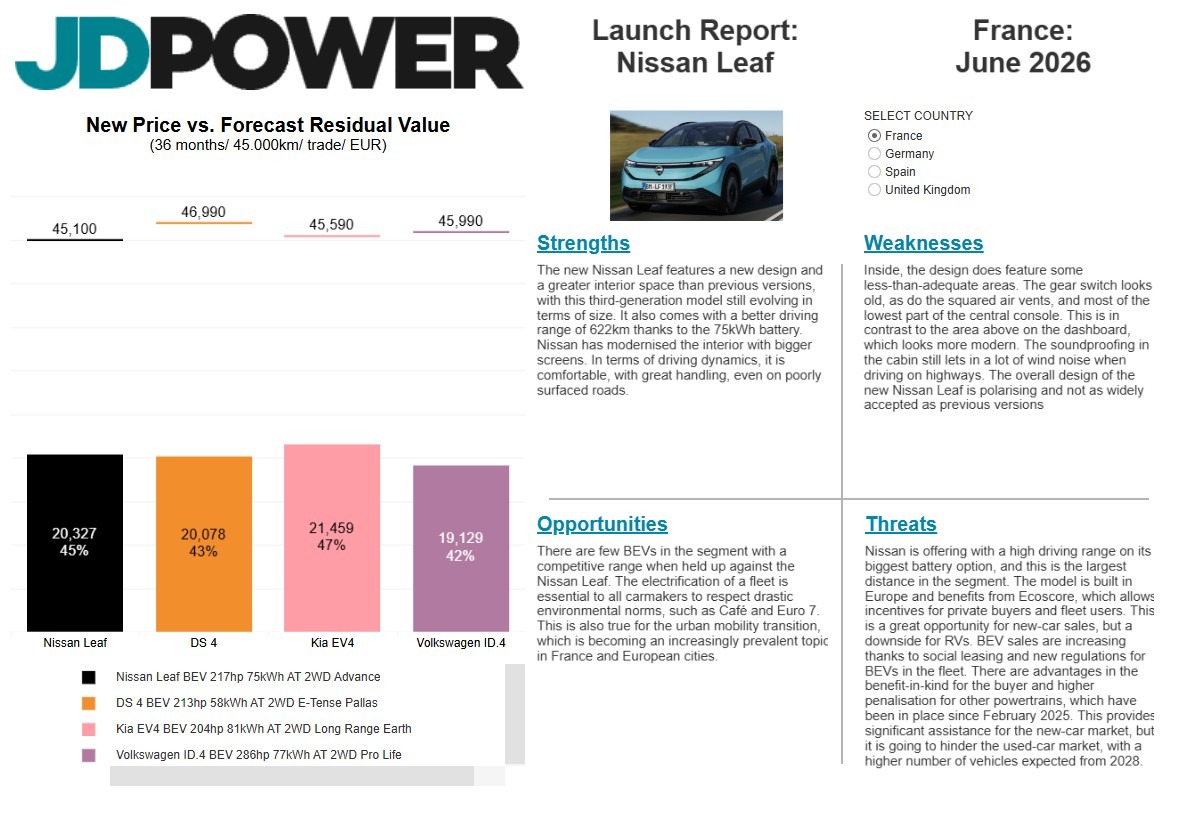
Autovista24’s latest Launch Report benchmarks the Nissan Leaf against its key competitors in France, Germany, Spain and the UK. Regional experts also provide a breakdown of the car’s strengths, weaknesses, opportunities and threats.
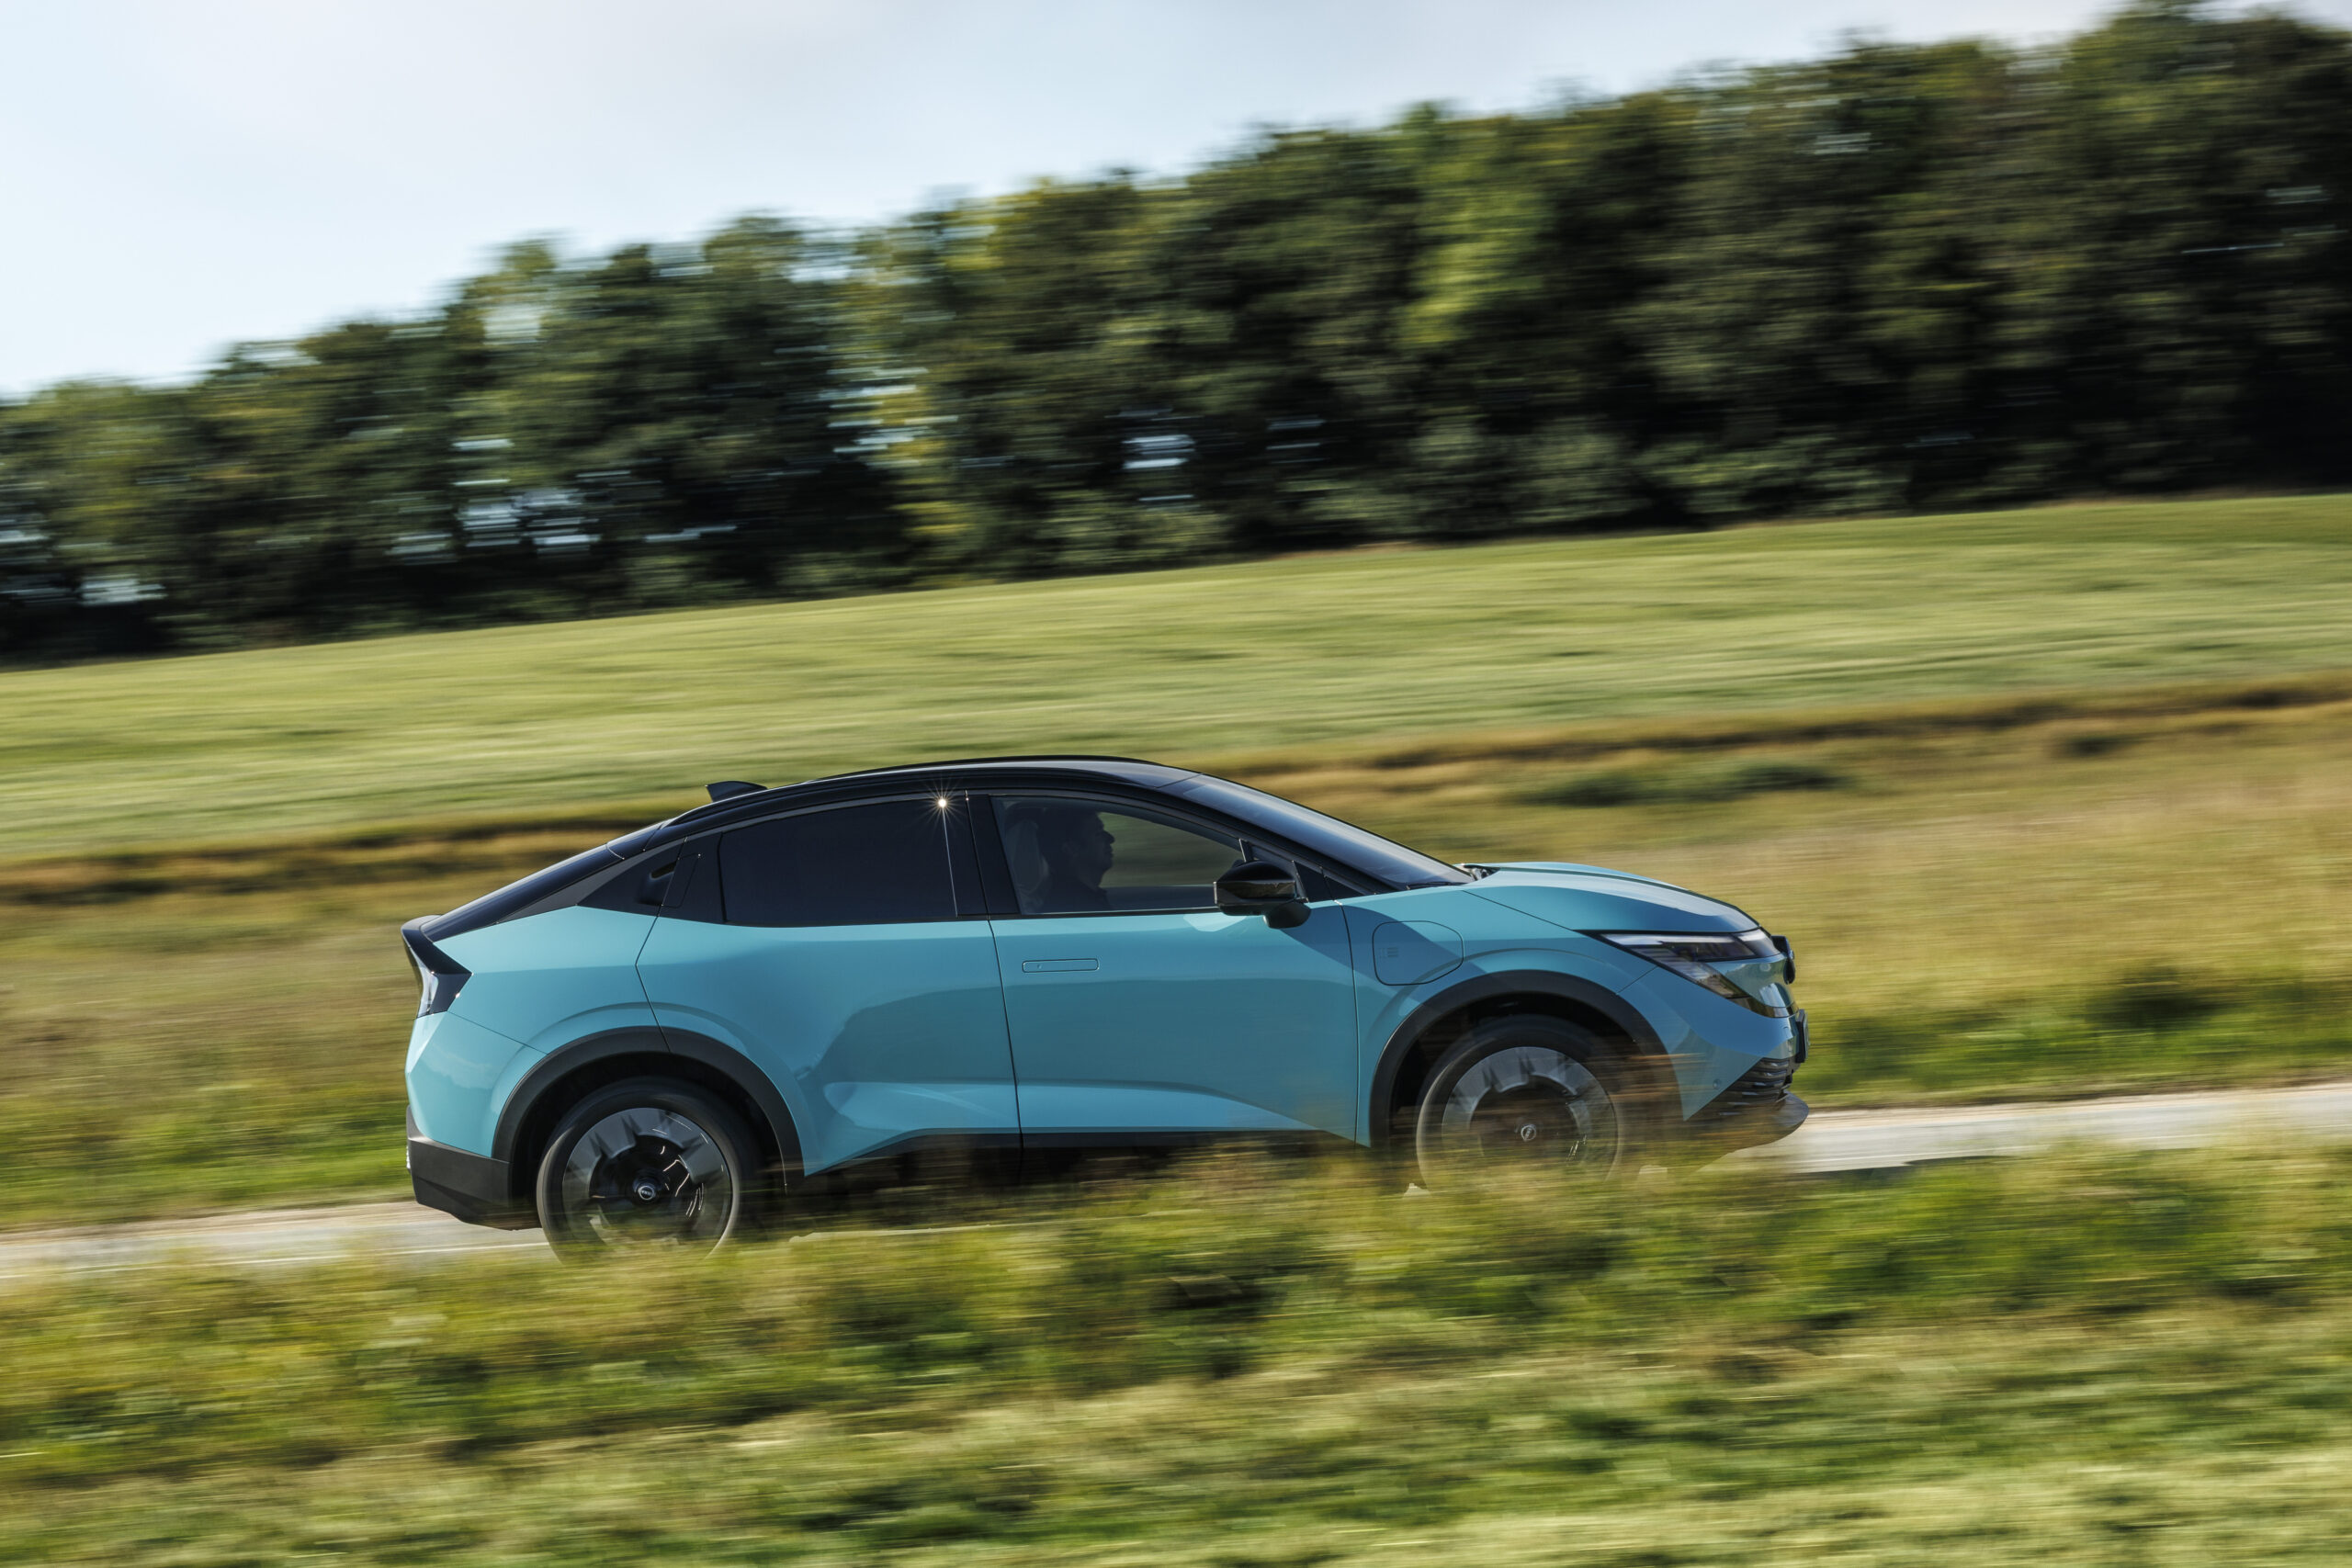
A bold design for the Nissan Leaf
Measuring 4.35 metres long, the new car is shorter than its predecessor. However, the change in body design comes as the Japanese carmaker revives the smaller Micra. For those looking for a larger, coupé-styled BEV, the Leaf offers some familiar design touches.
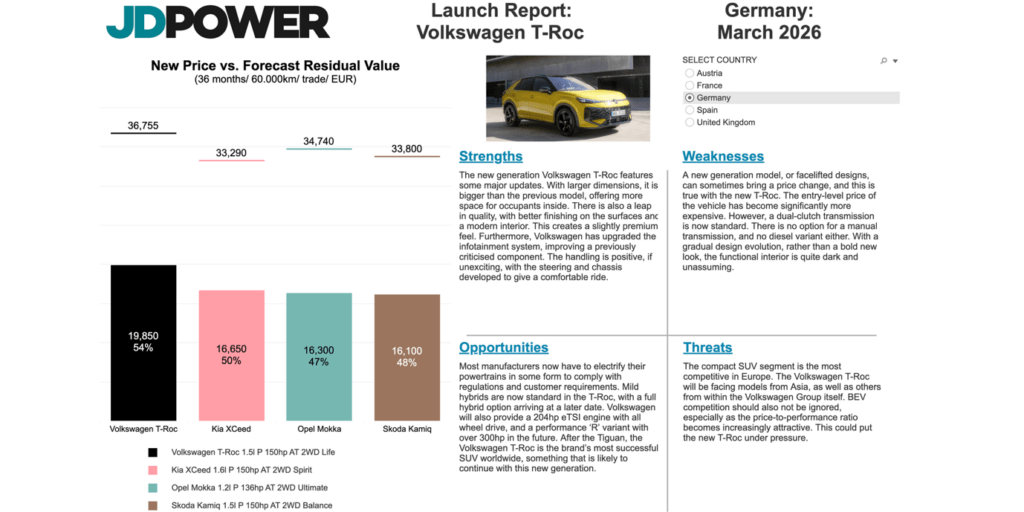
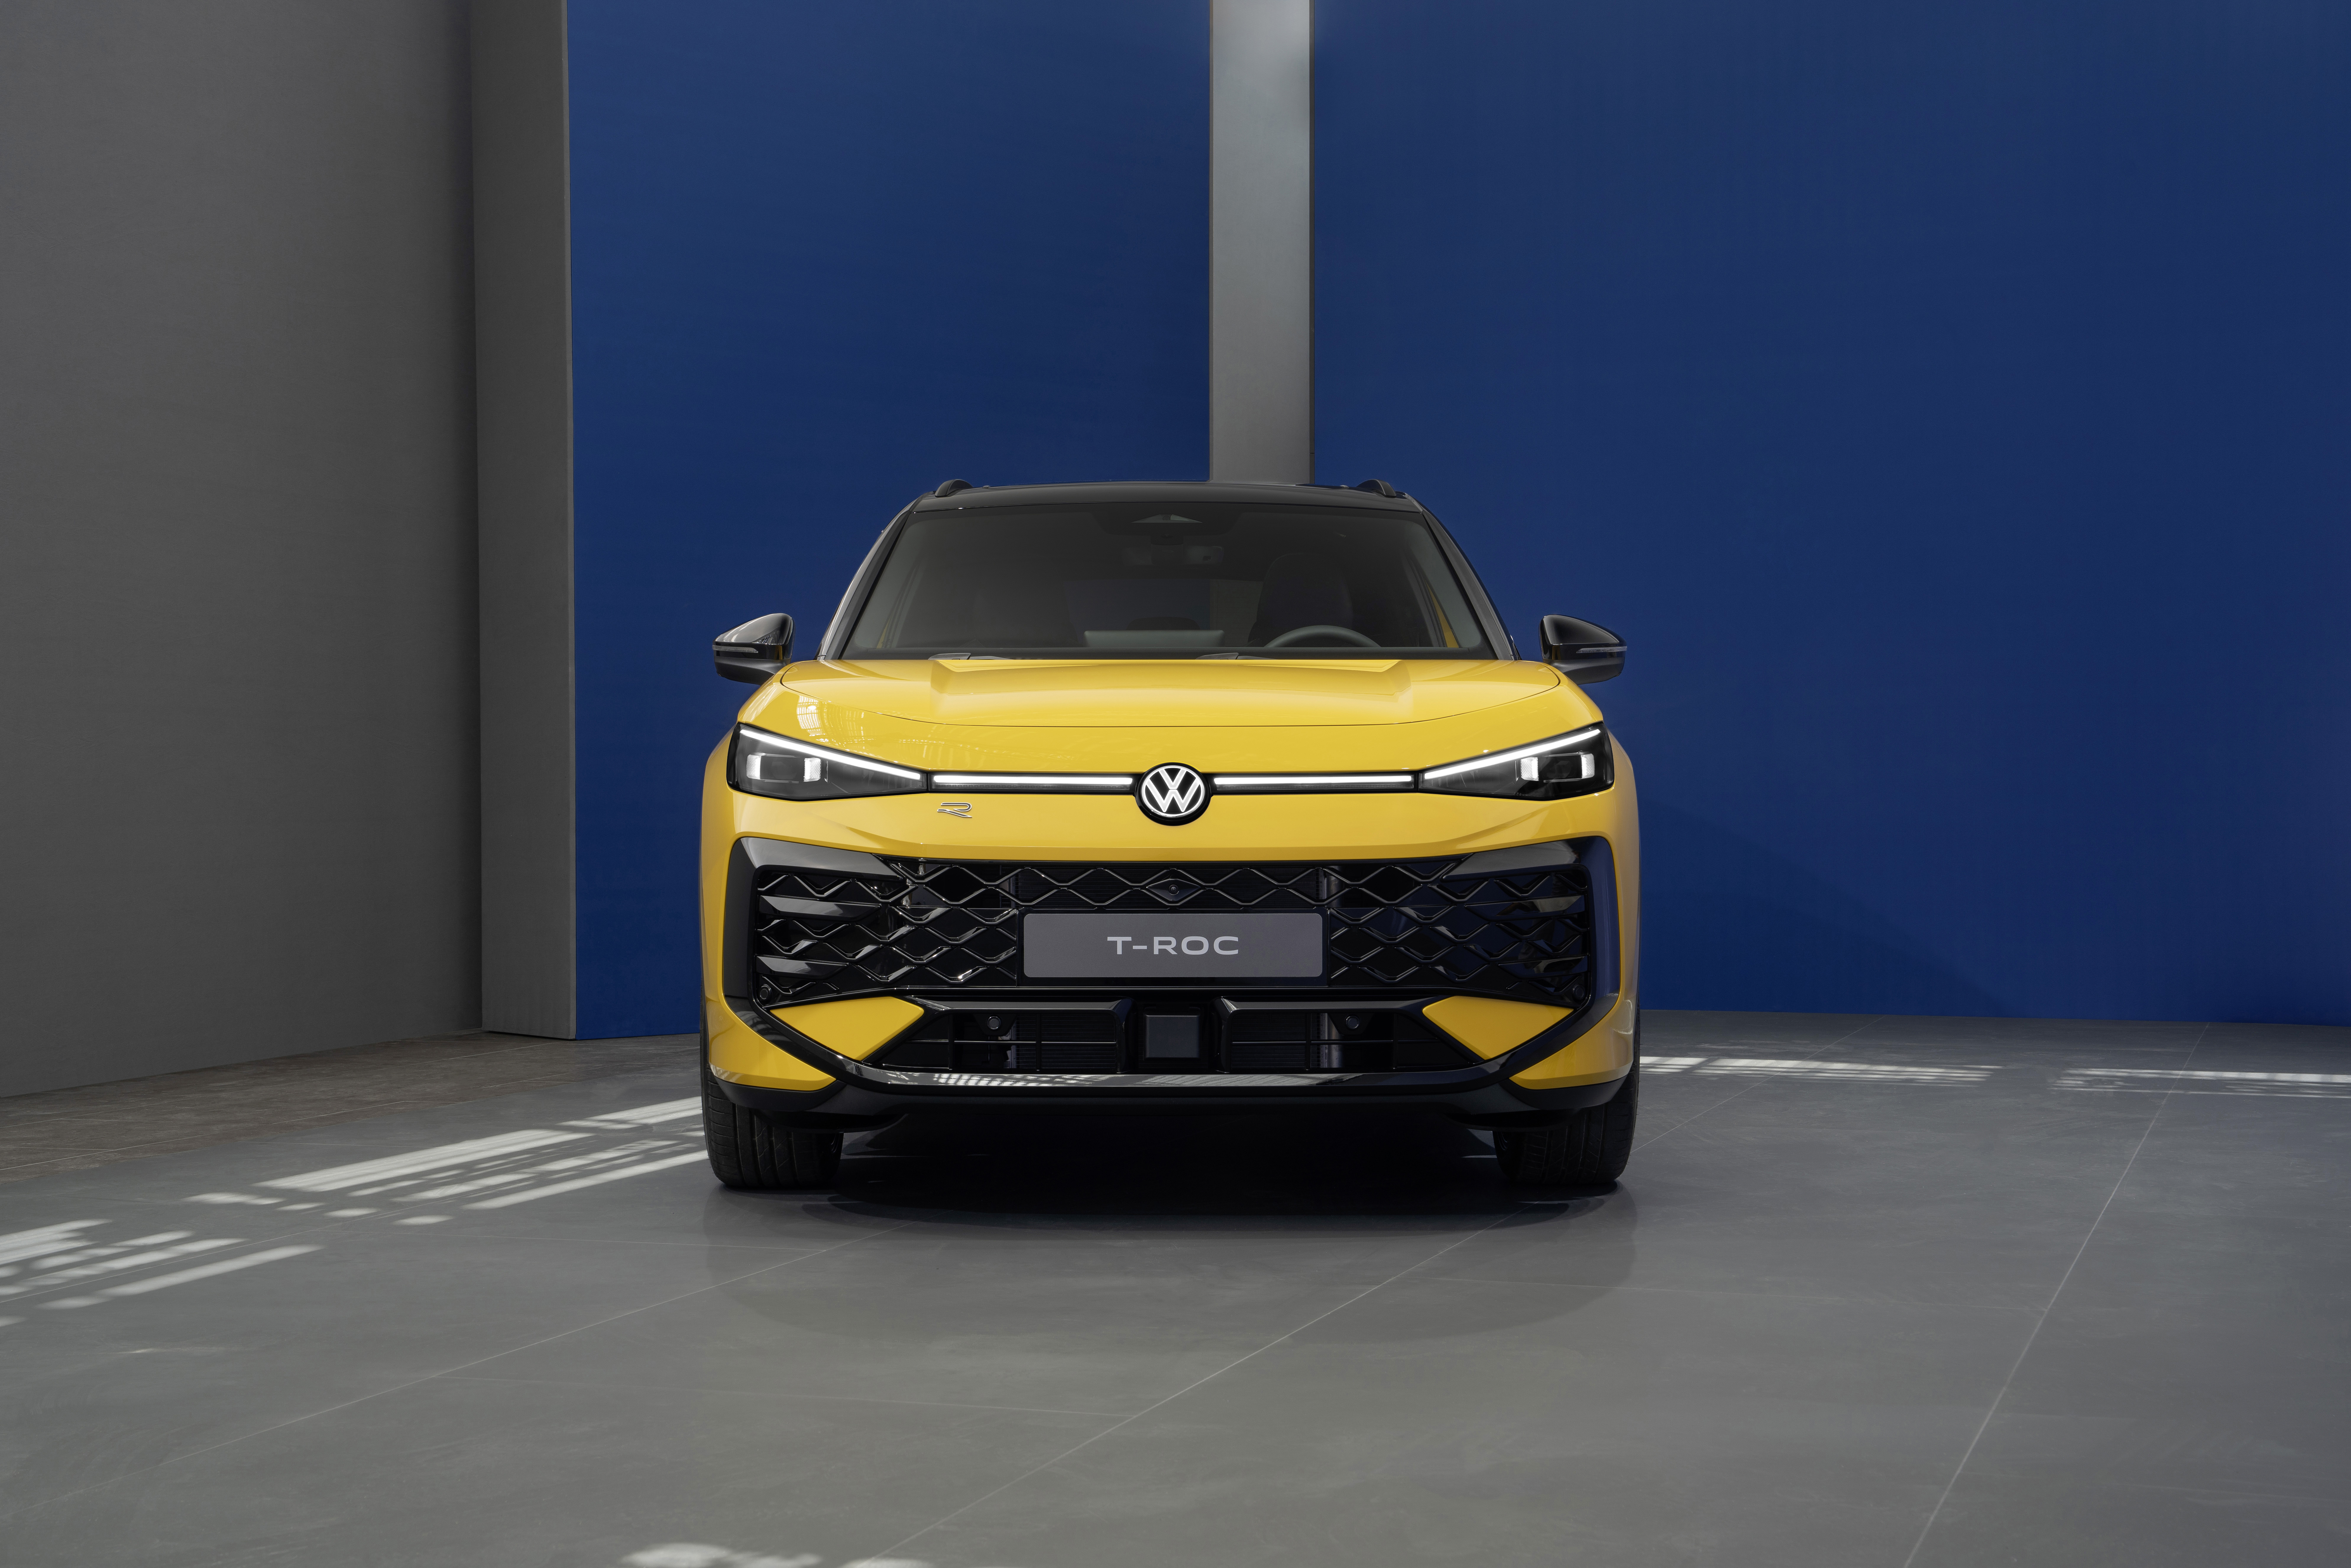
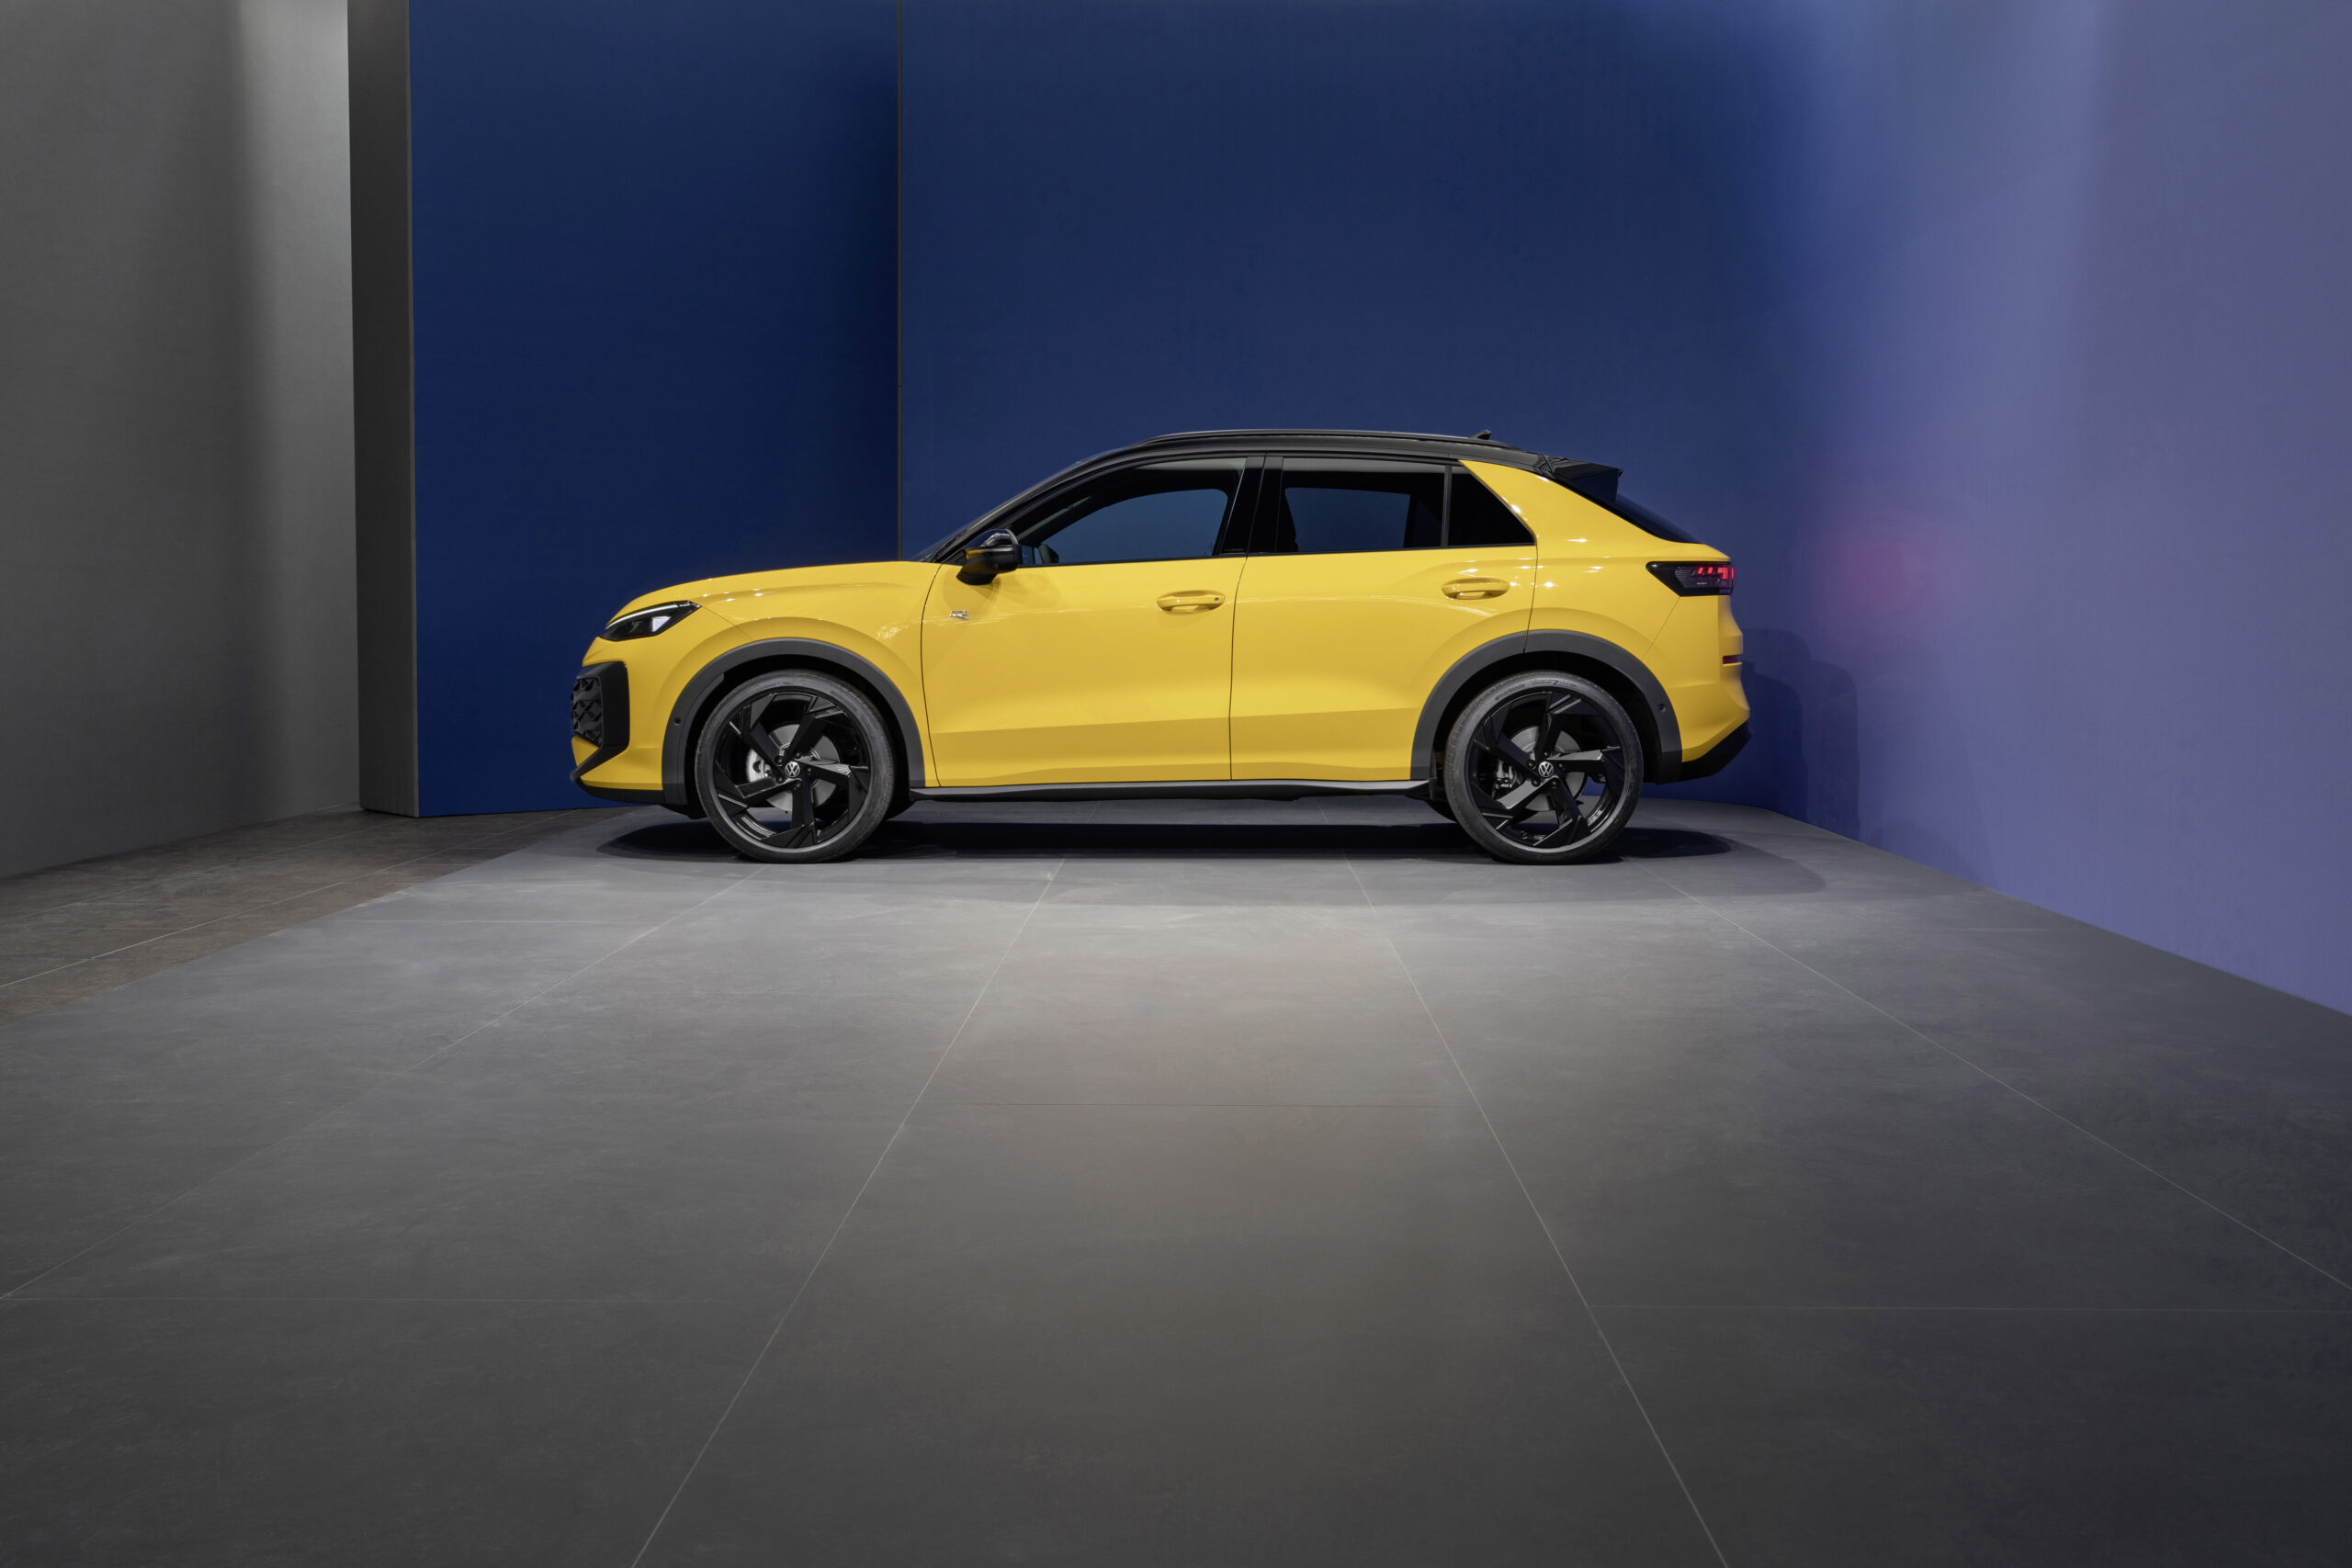
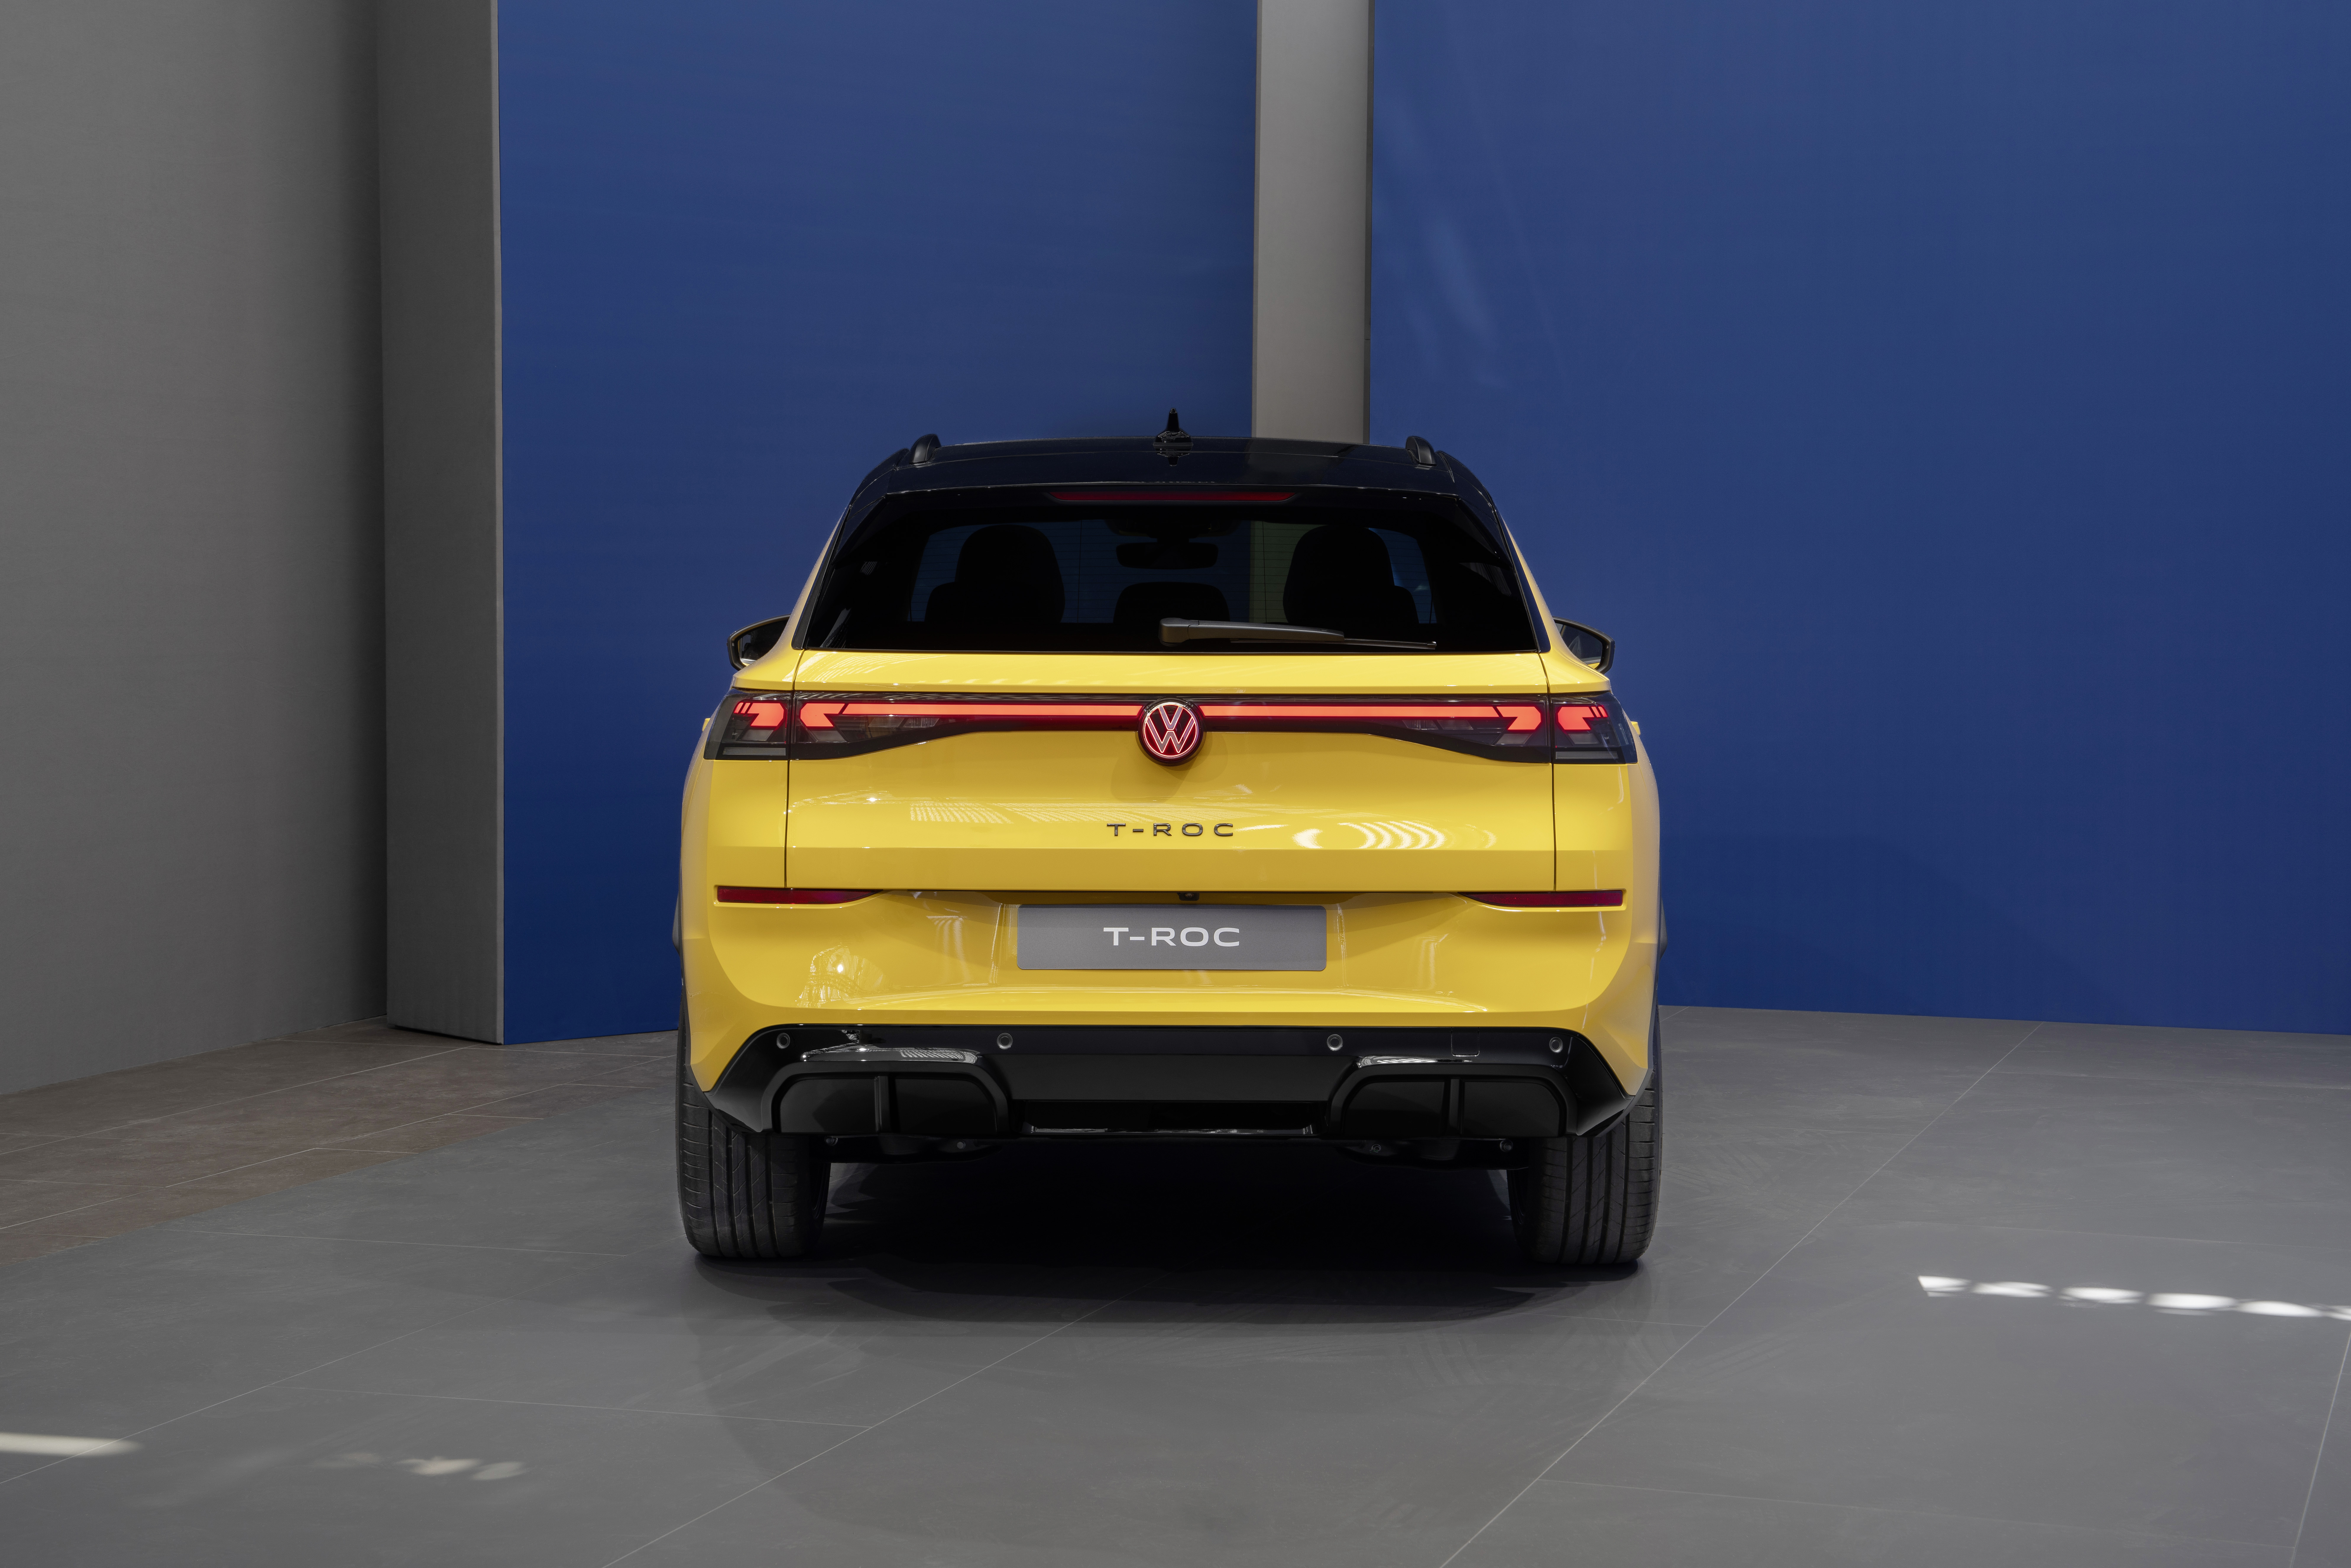
Source: Nissan
The design philosophy is similar to that of the Nissan Ariya. A long LED-bar lighting profile sweeps down each side of the ‘grill’ to provide a distinctive silhouette. The large, illuminated manufacturer’s badge breaks up what is otherwise a minimalist front end.
The new model manages to blend both sharp angles and curves with ease. The lower part of the front end forgoes any colour coding, which does stand out with lighter colour choices. Blending the coloured section in at the front wheels adds to the sharp look of the car.
The rounded roof is designed to help reduce drag as it slants towards the rear. It feels almost familiar, considering Nissan’s curvy design philosophy of the early 2000s.
At the rear, the coupé lines end in an upward flick, as the 3D lights add another smart design touch. The lack of a rear LED bar does, however, remove any symmetry between the front and back of the car.
Mixed messages
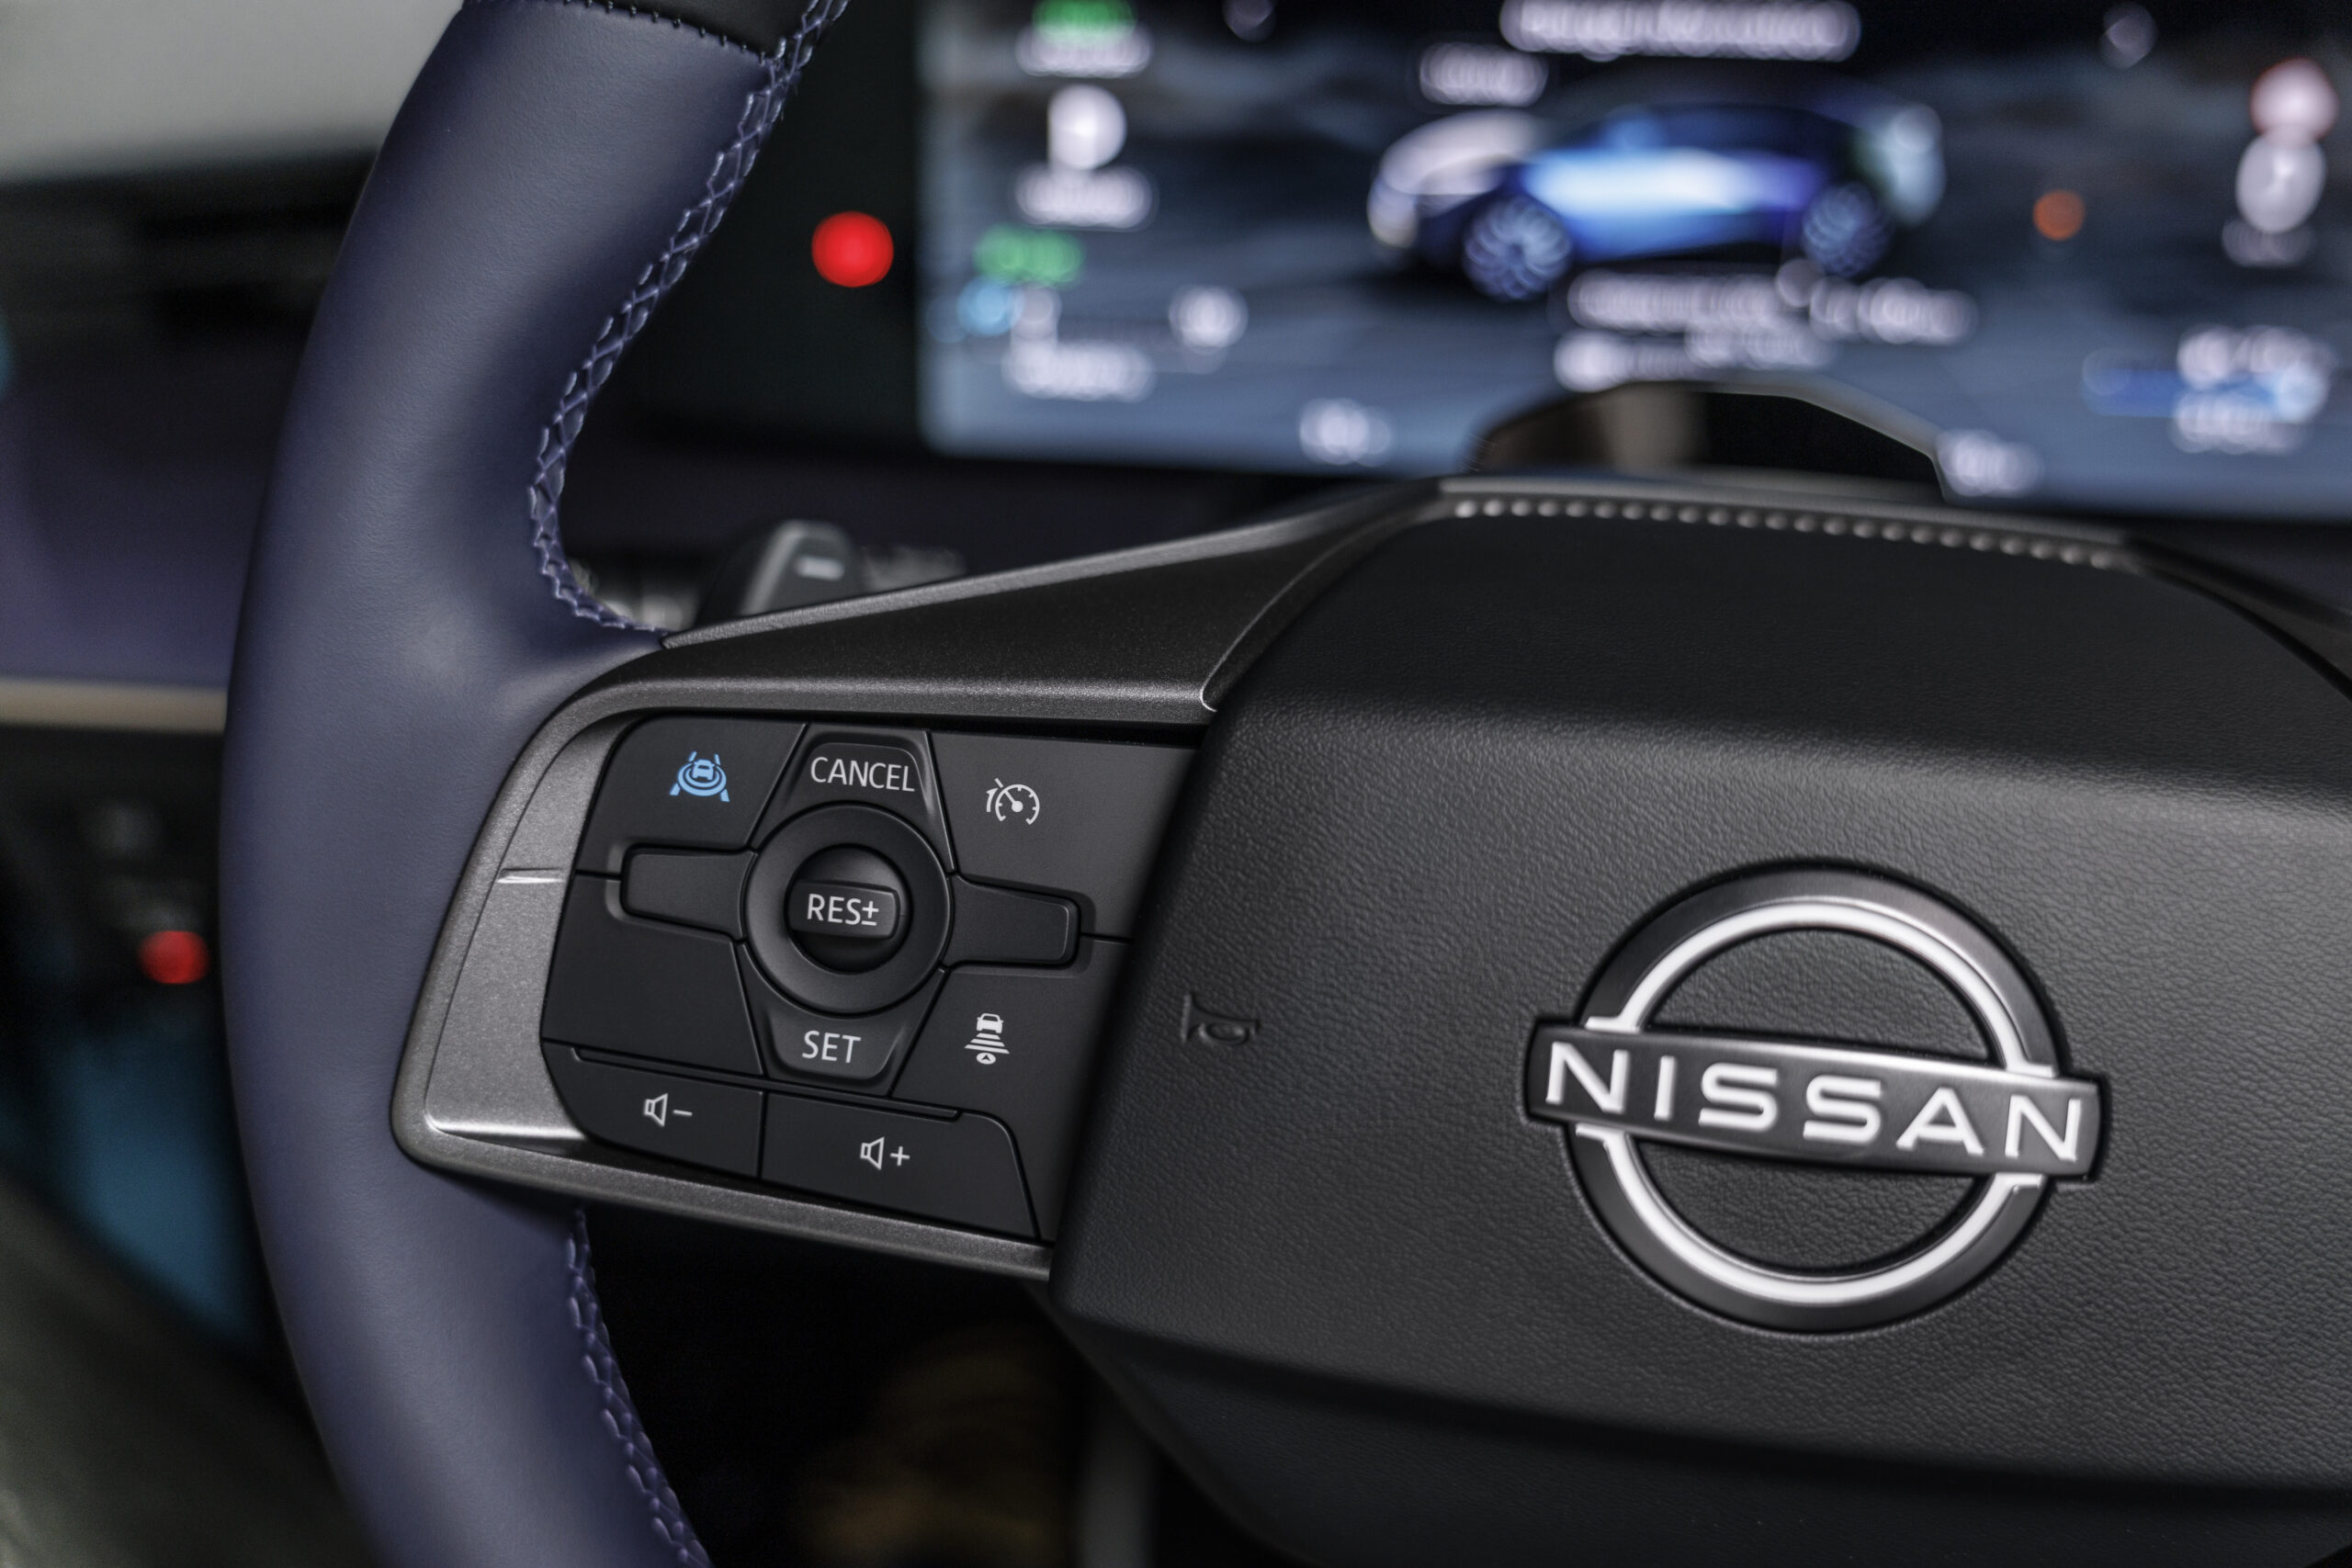
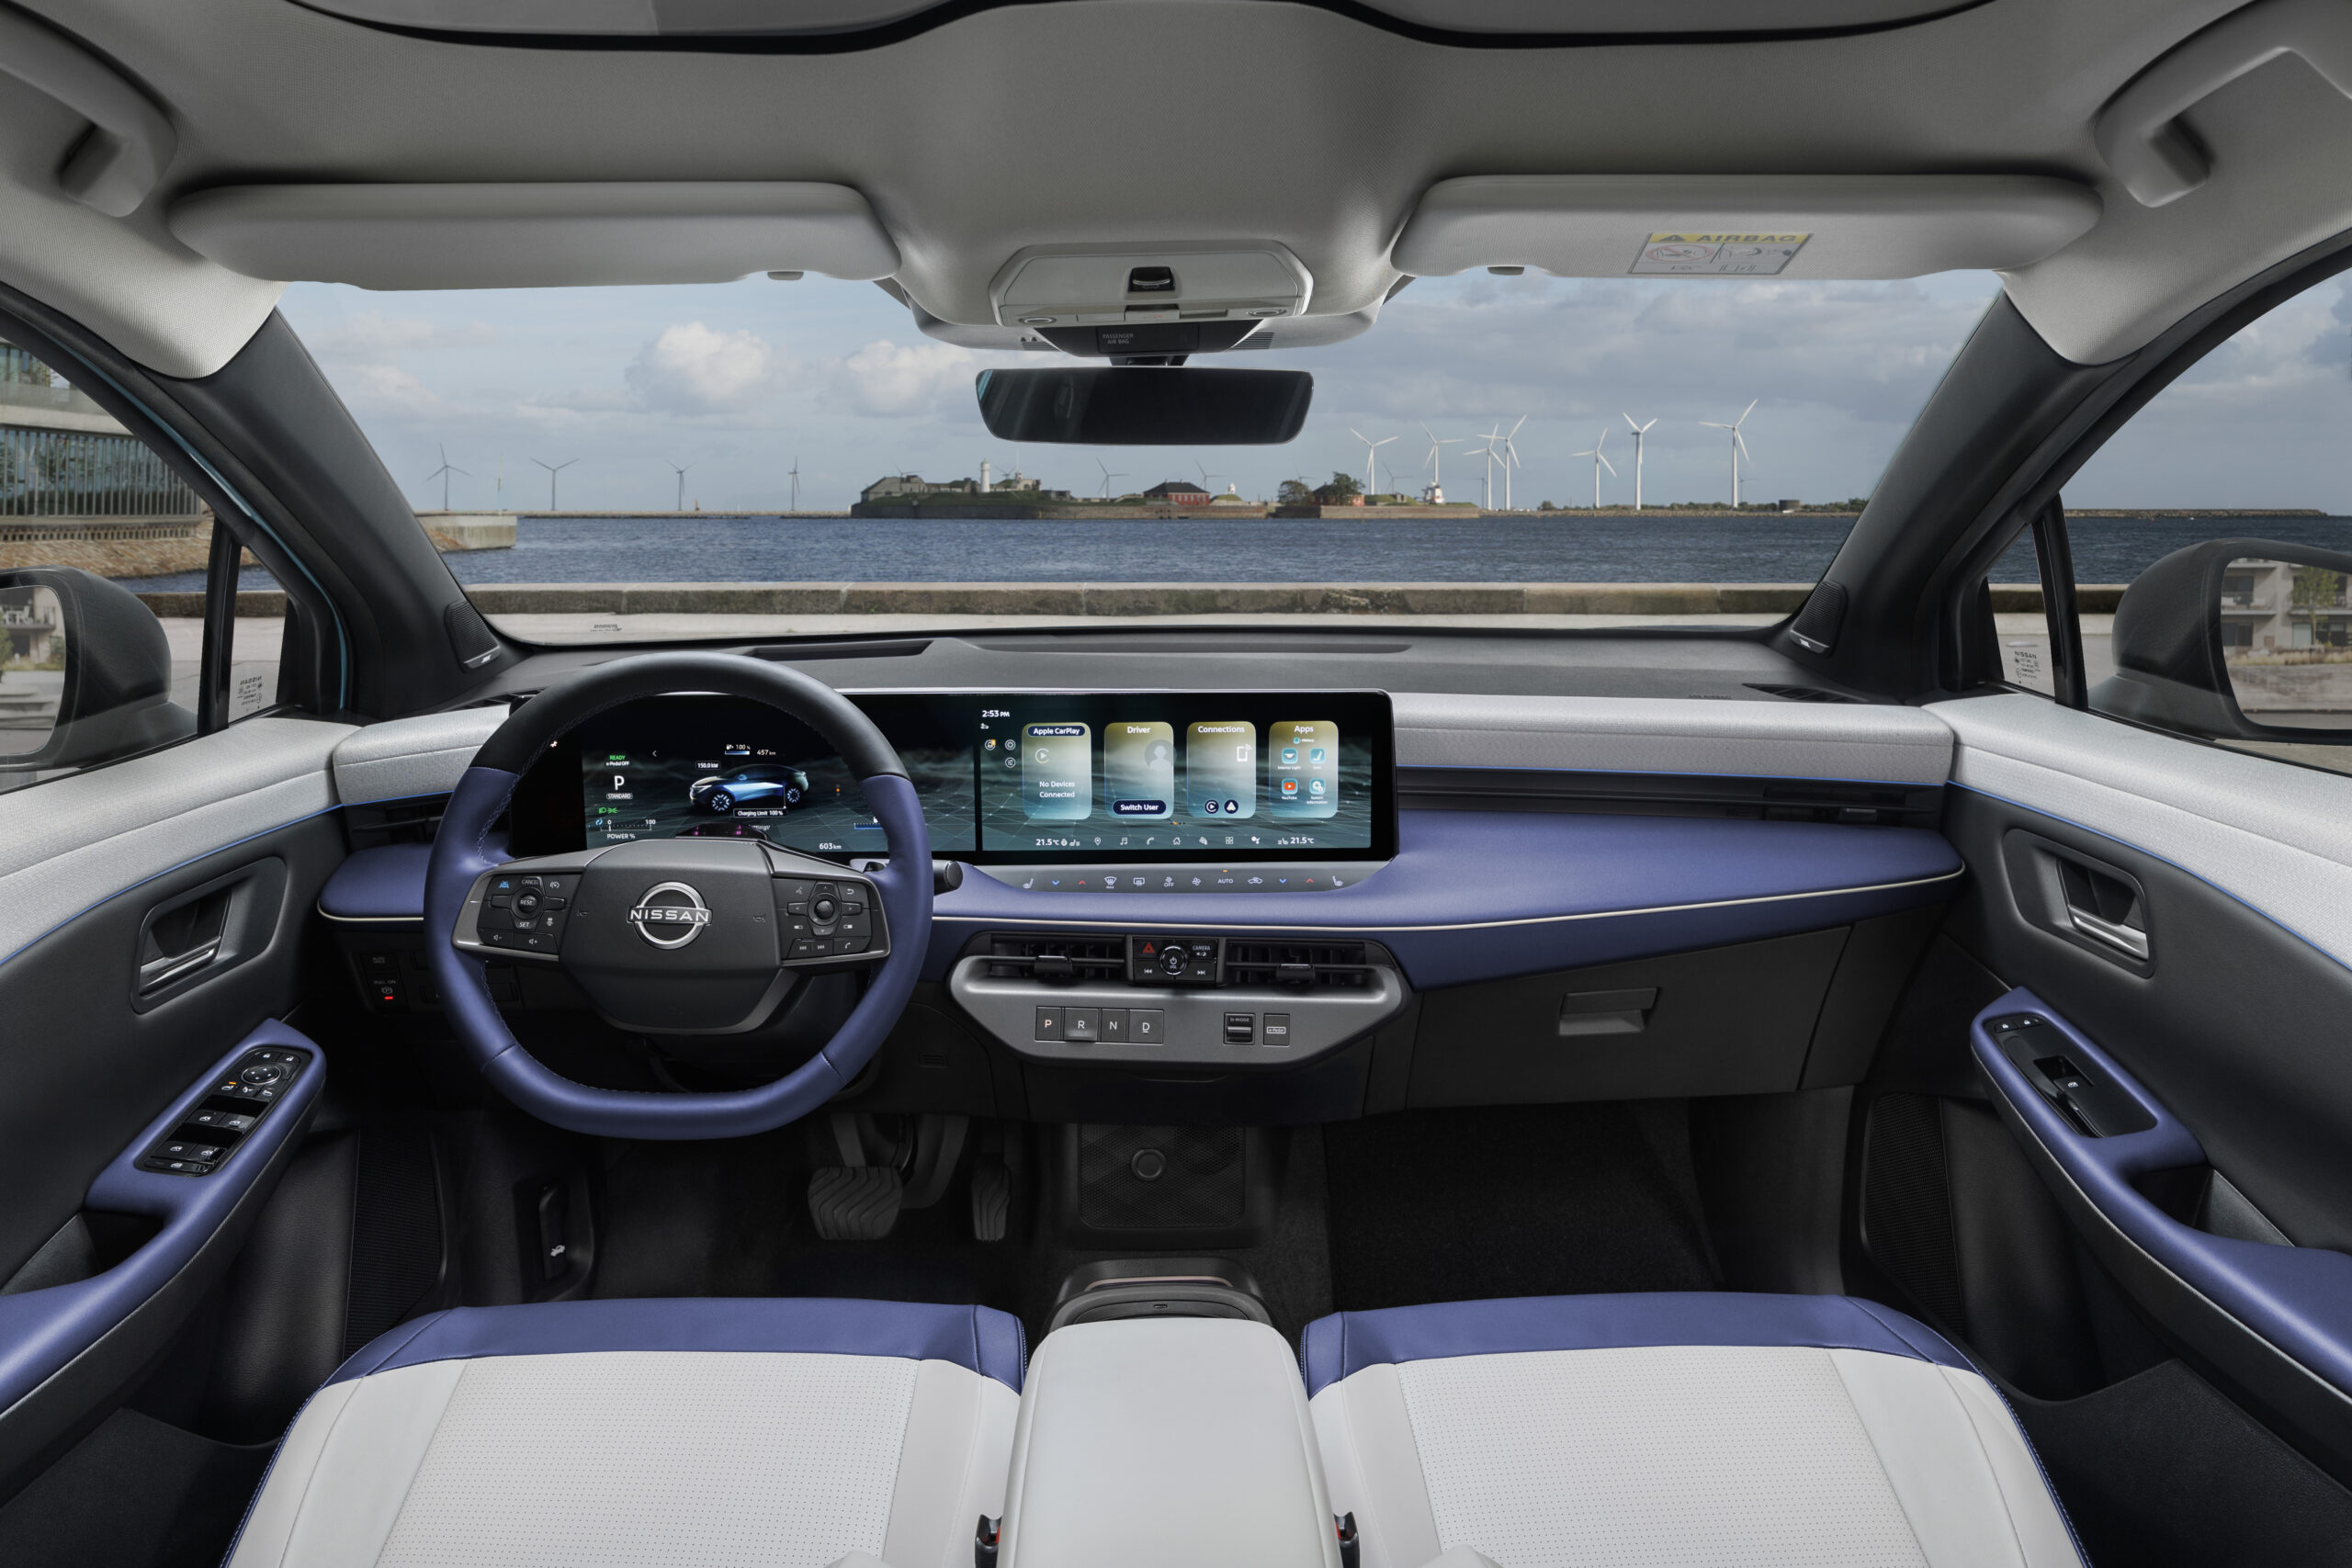
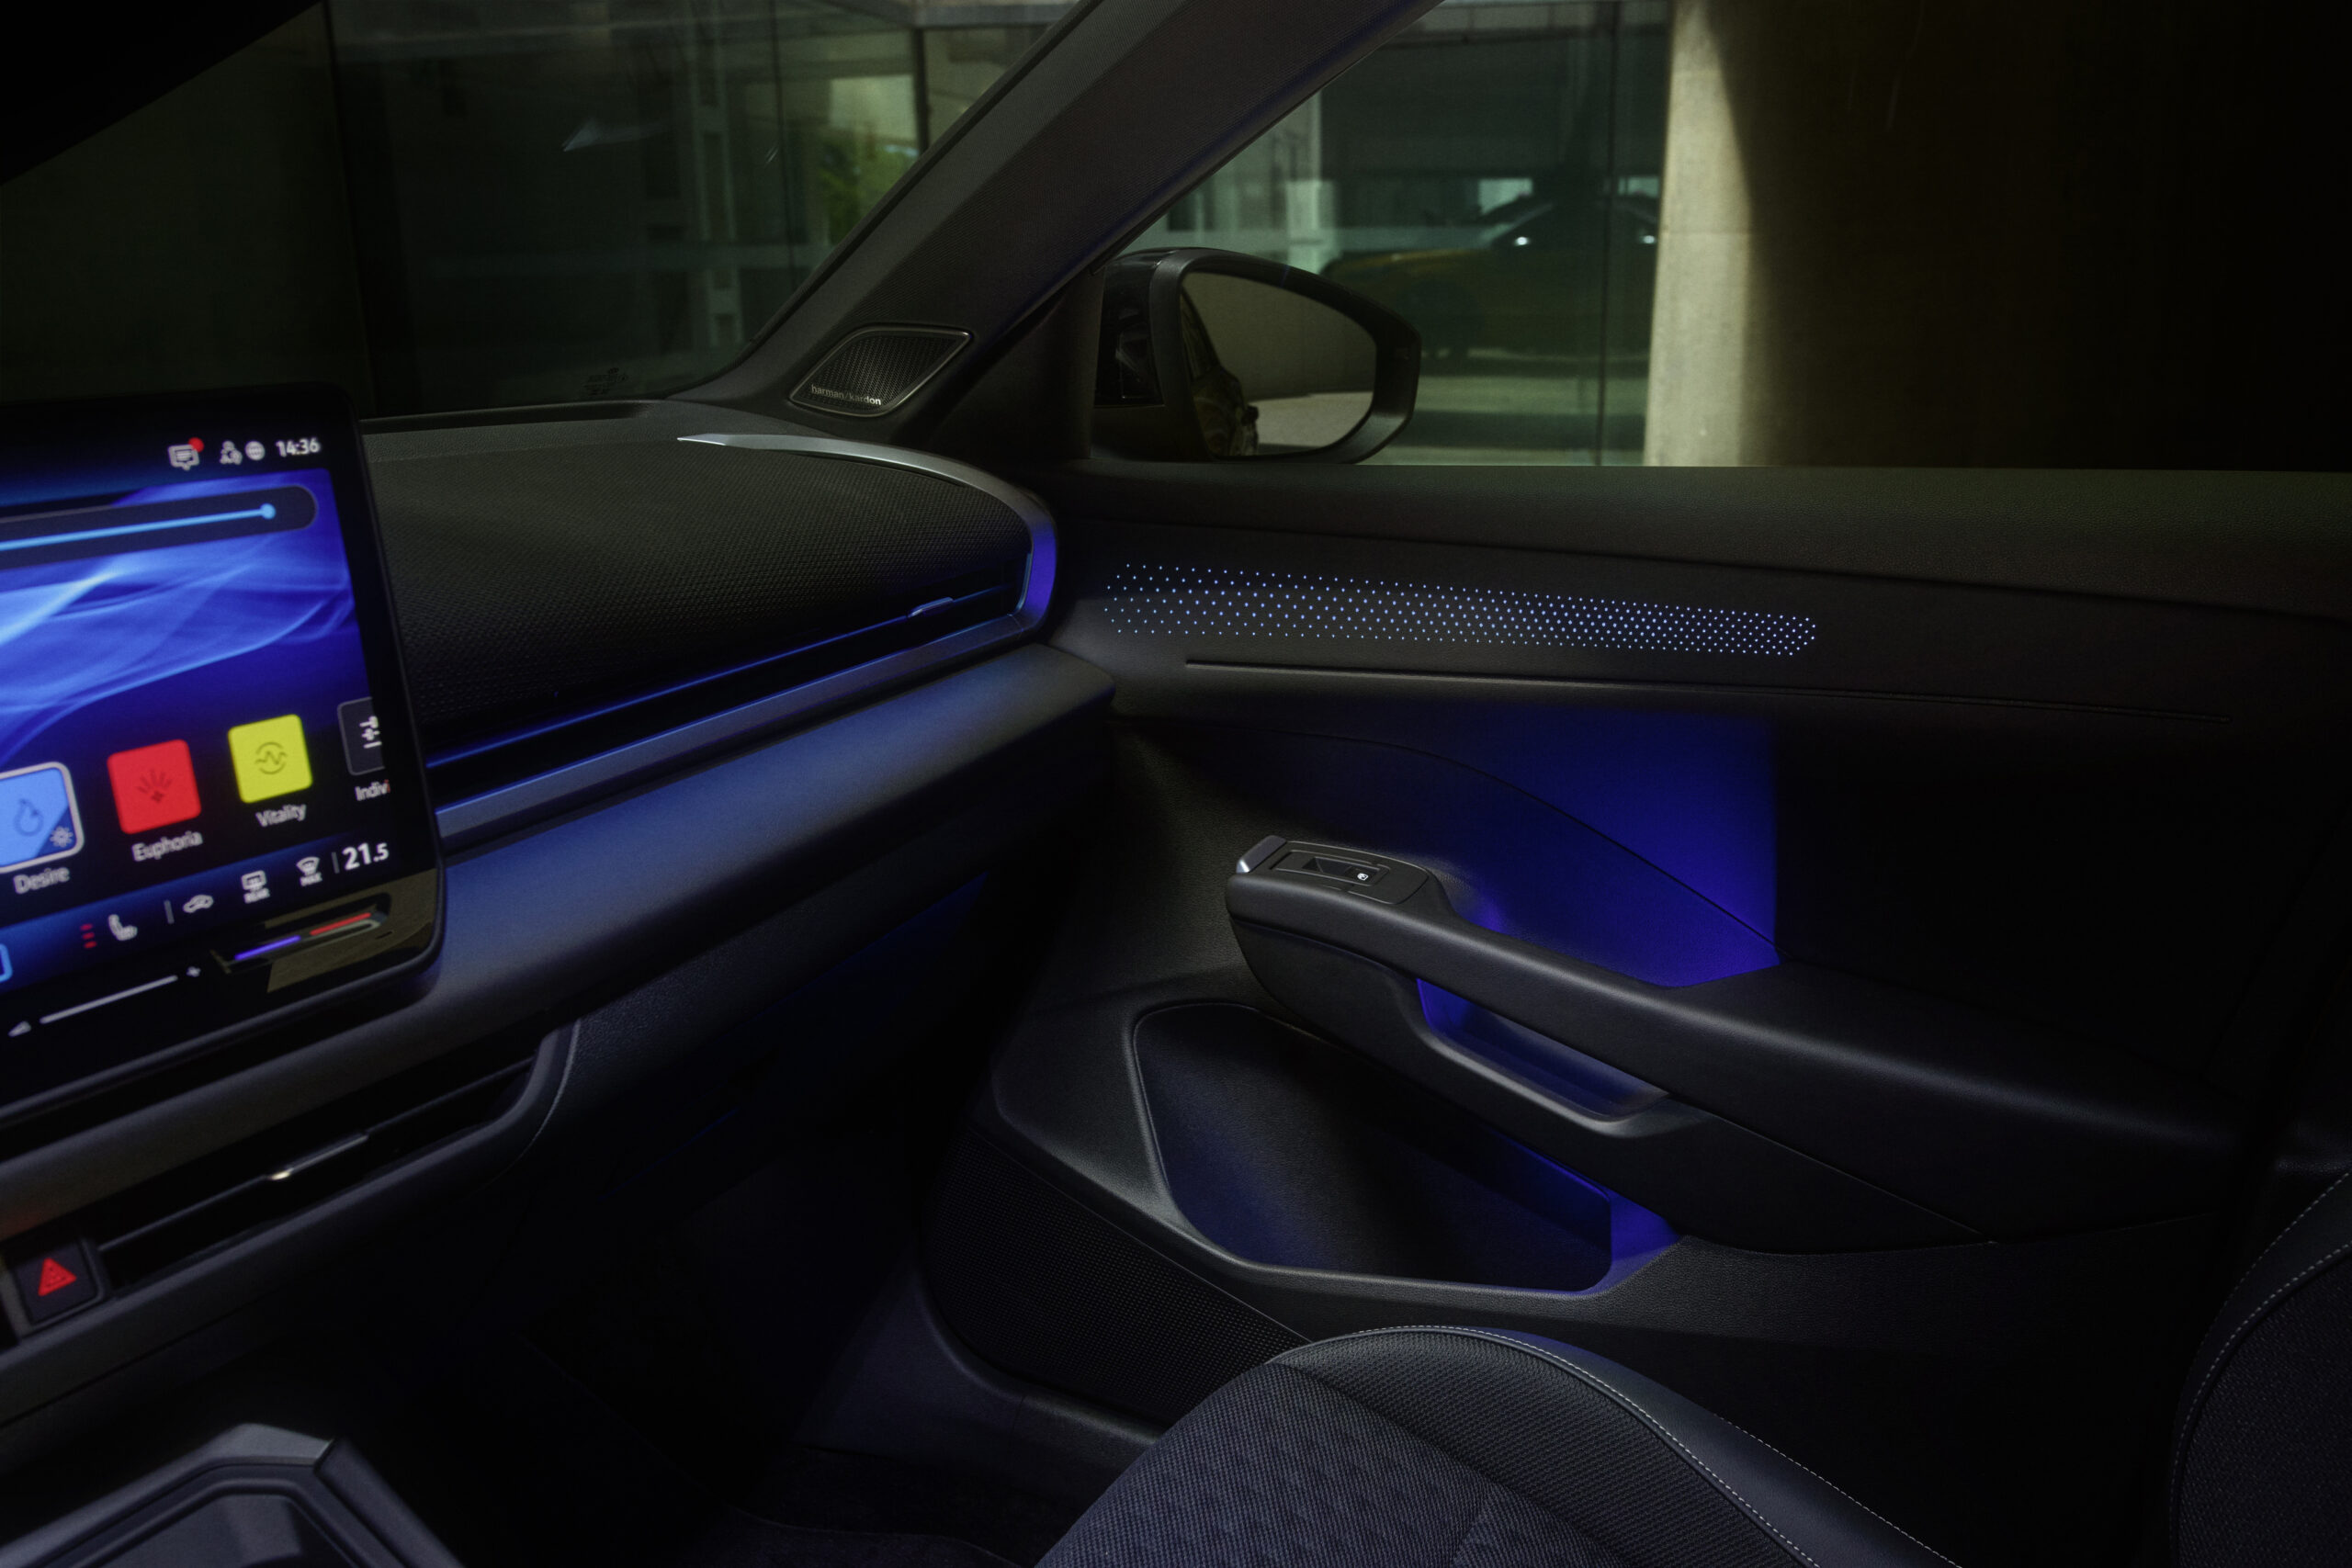
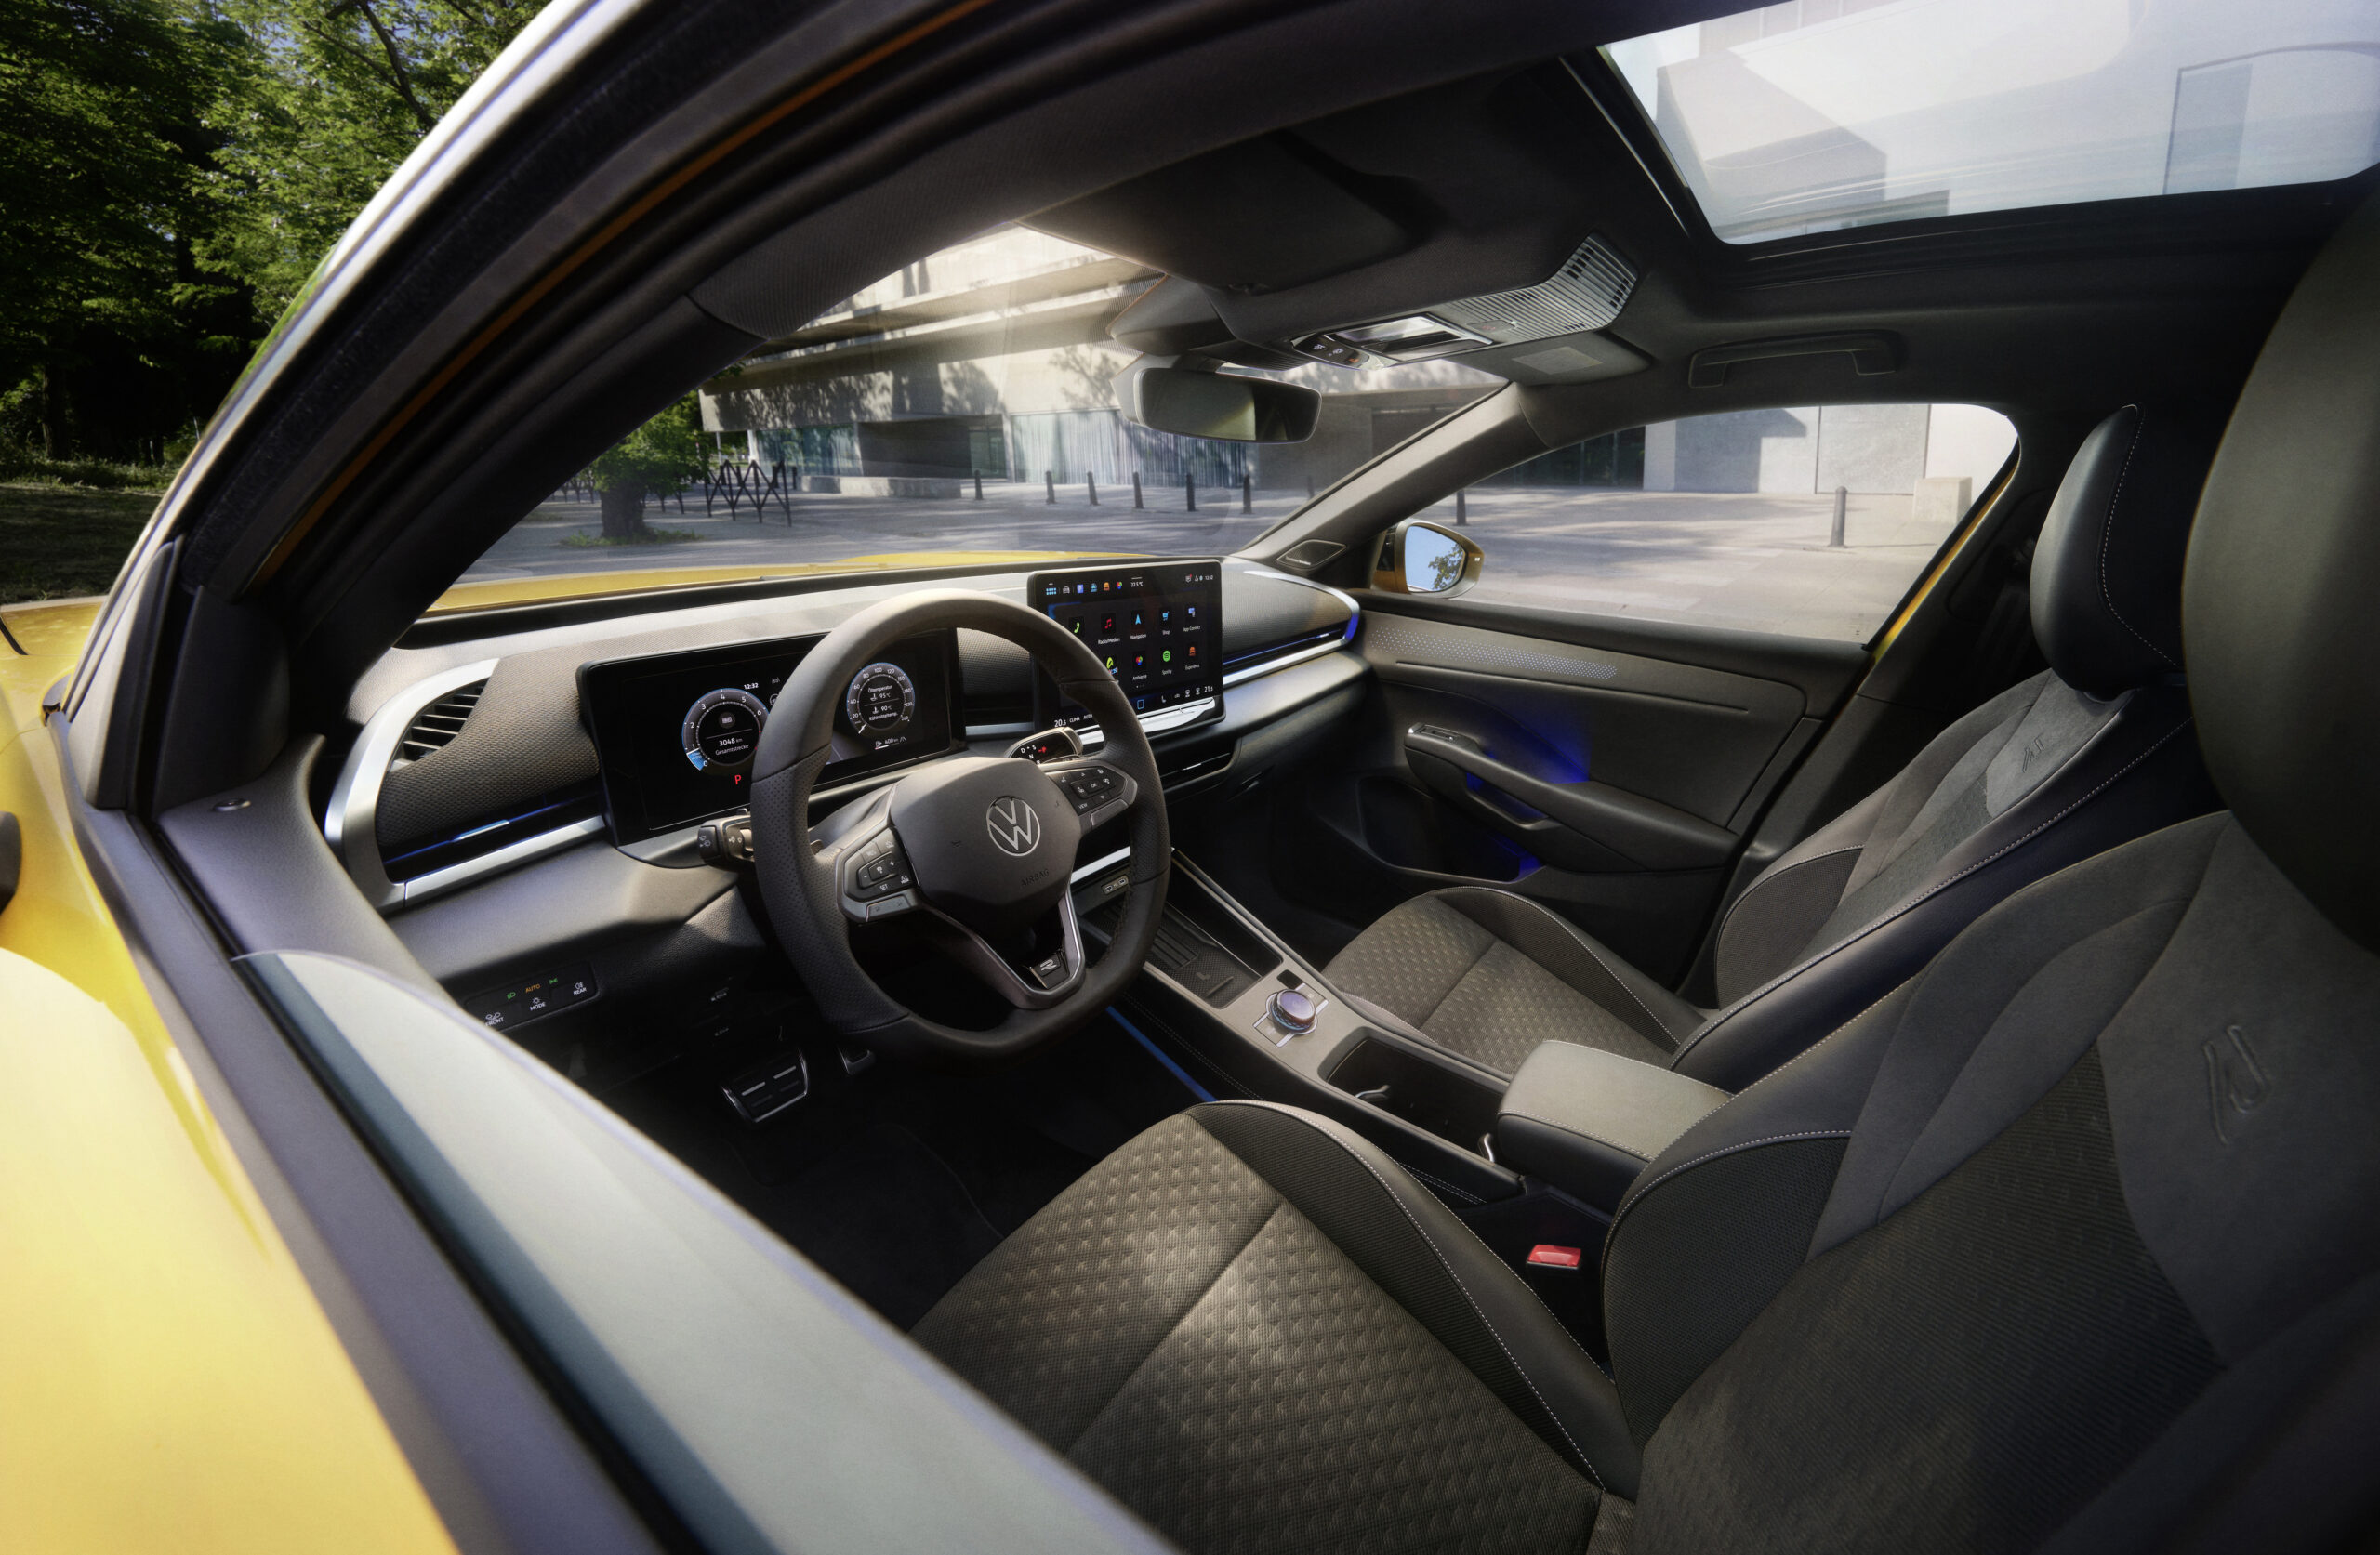
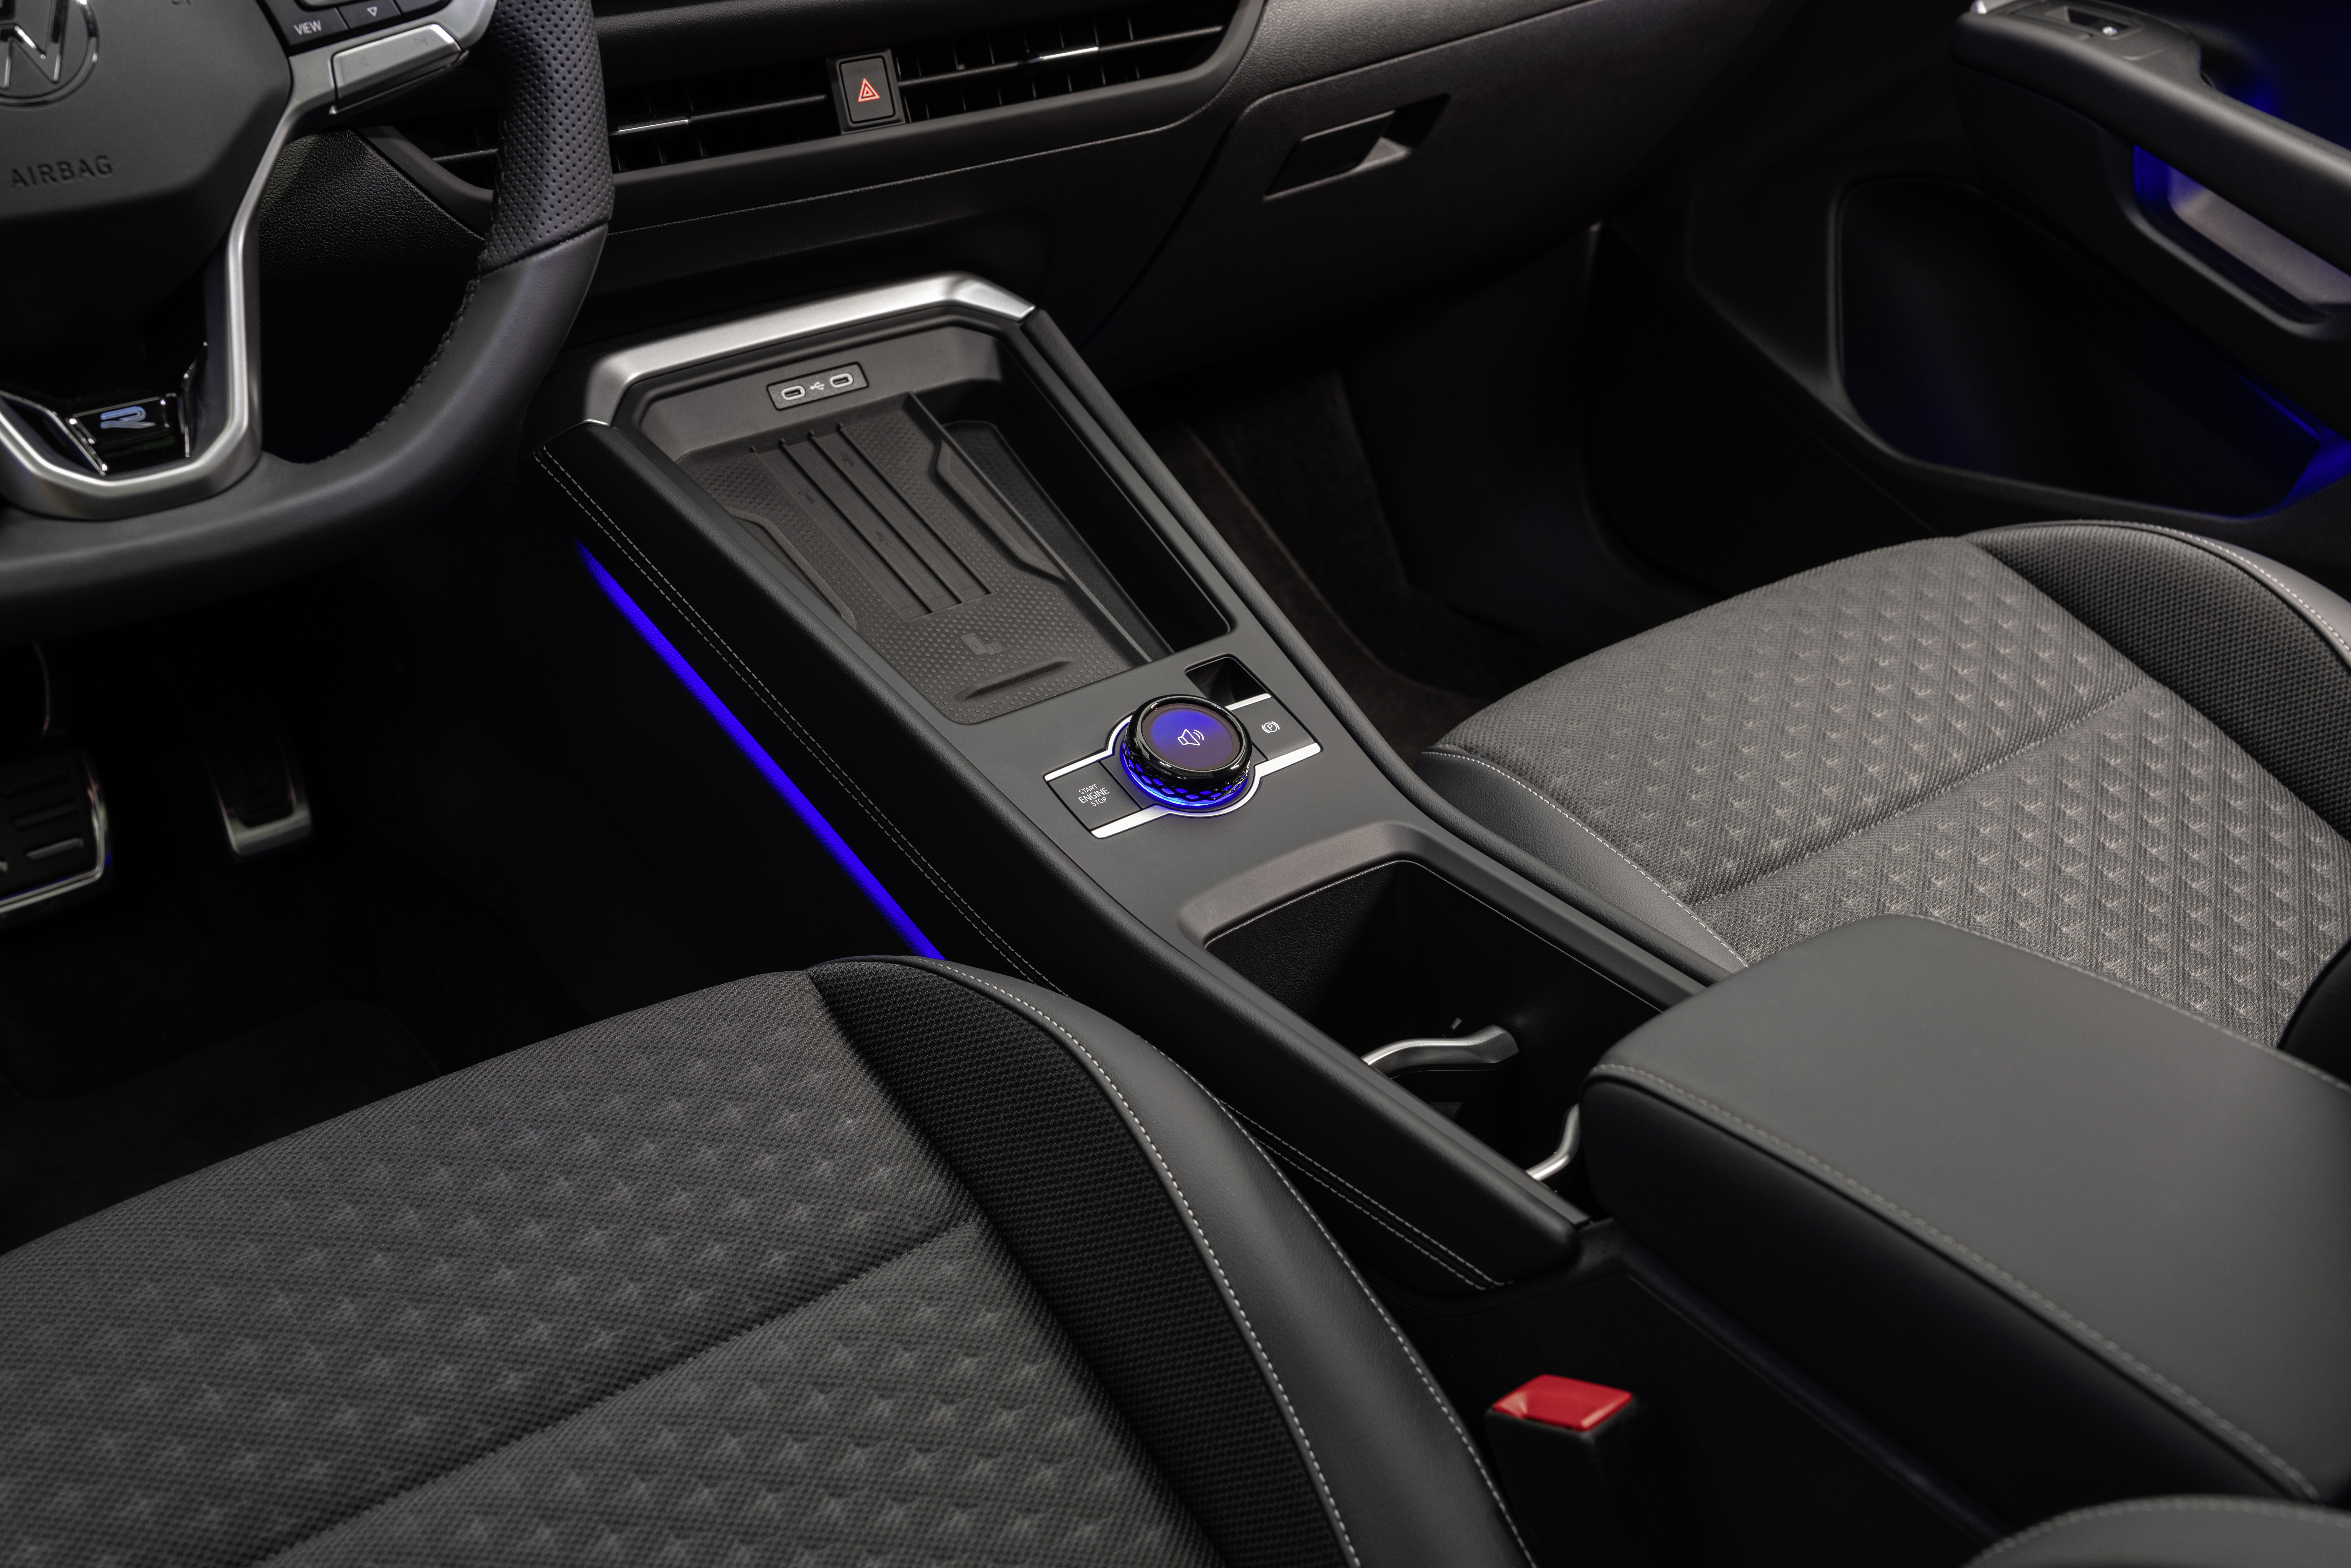
The Nissan Leaf’s minimalistic approach continues inside the cabin. Two 14.3-inch touchscreens relay information, with Google integration built in for more efficient mapping and software access.
There is also an array of physical buttons, mixed with touch-sensitive controls and touchscreen options. This may be refreshing compared to models which rely on a central touchscreen, but the approach does cause issues.
Source: Nissan
The automatic gear selection is made using buttons rather than a dedicated lever or switch. Their positioning on a separate console below the dashboard seems like an afterthought. It appears out of place compared to the sleek wraparound design of the upper portion of the dashboard.
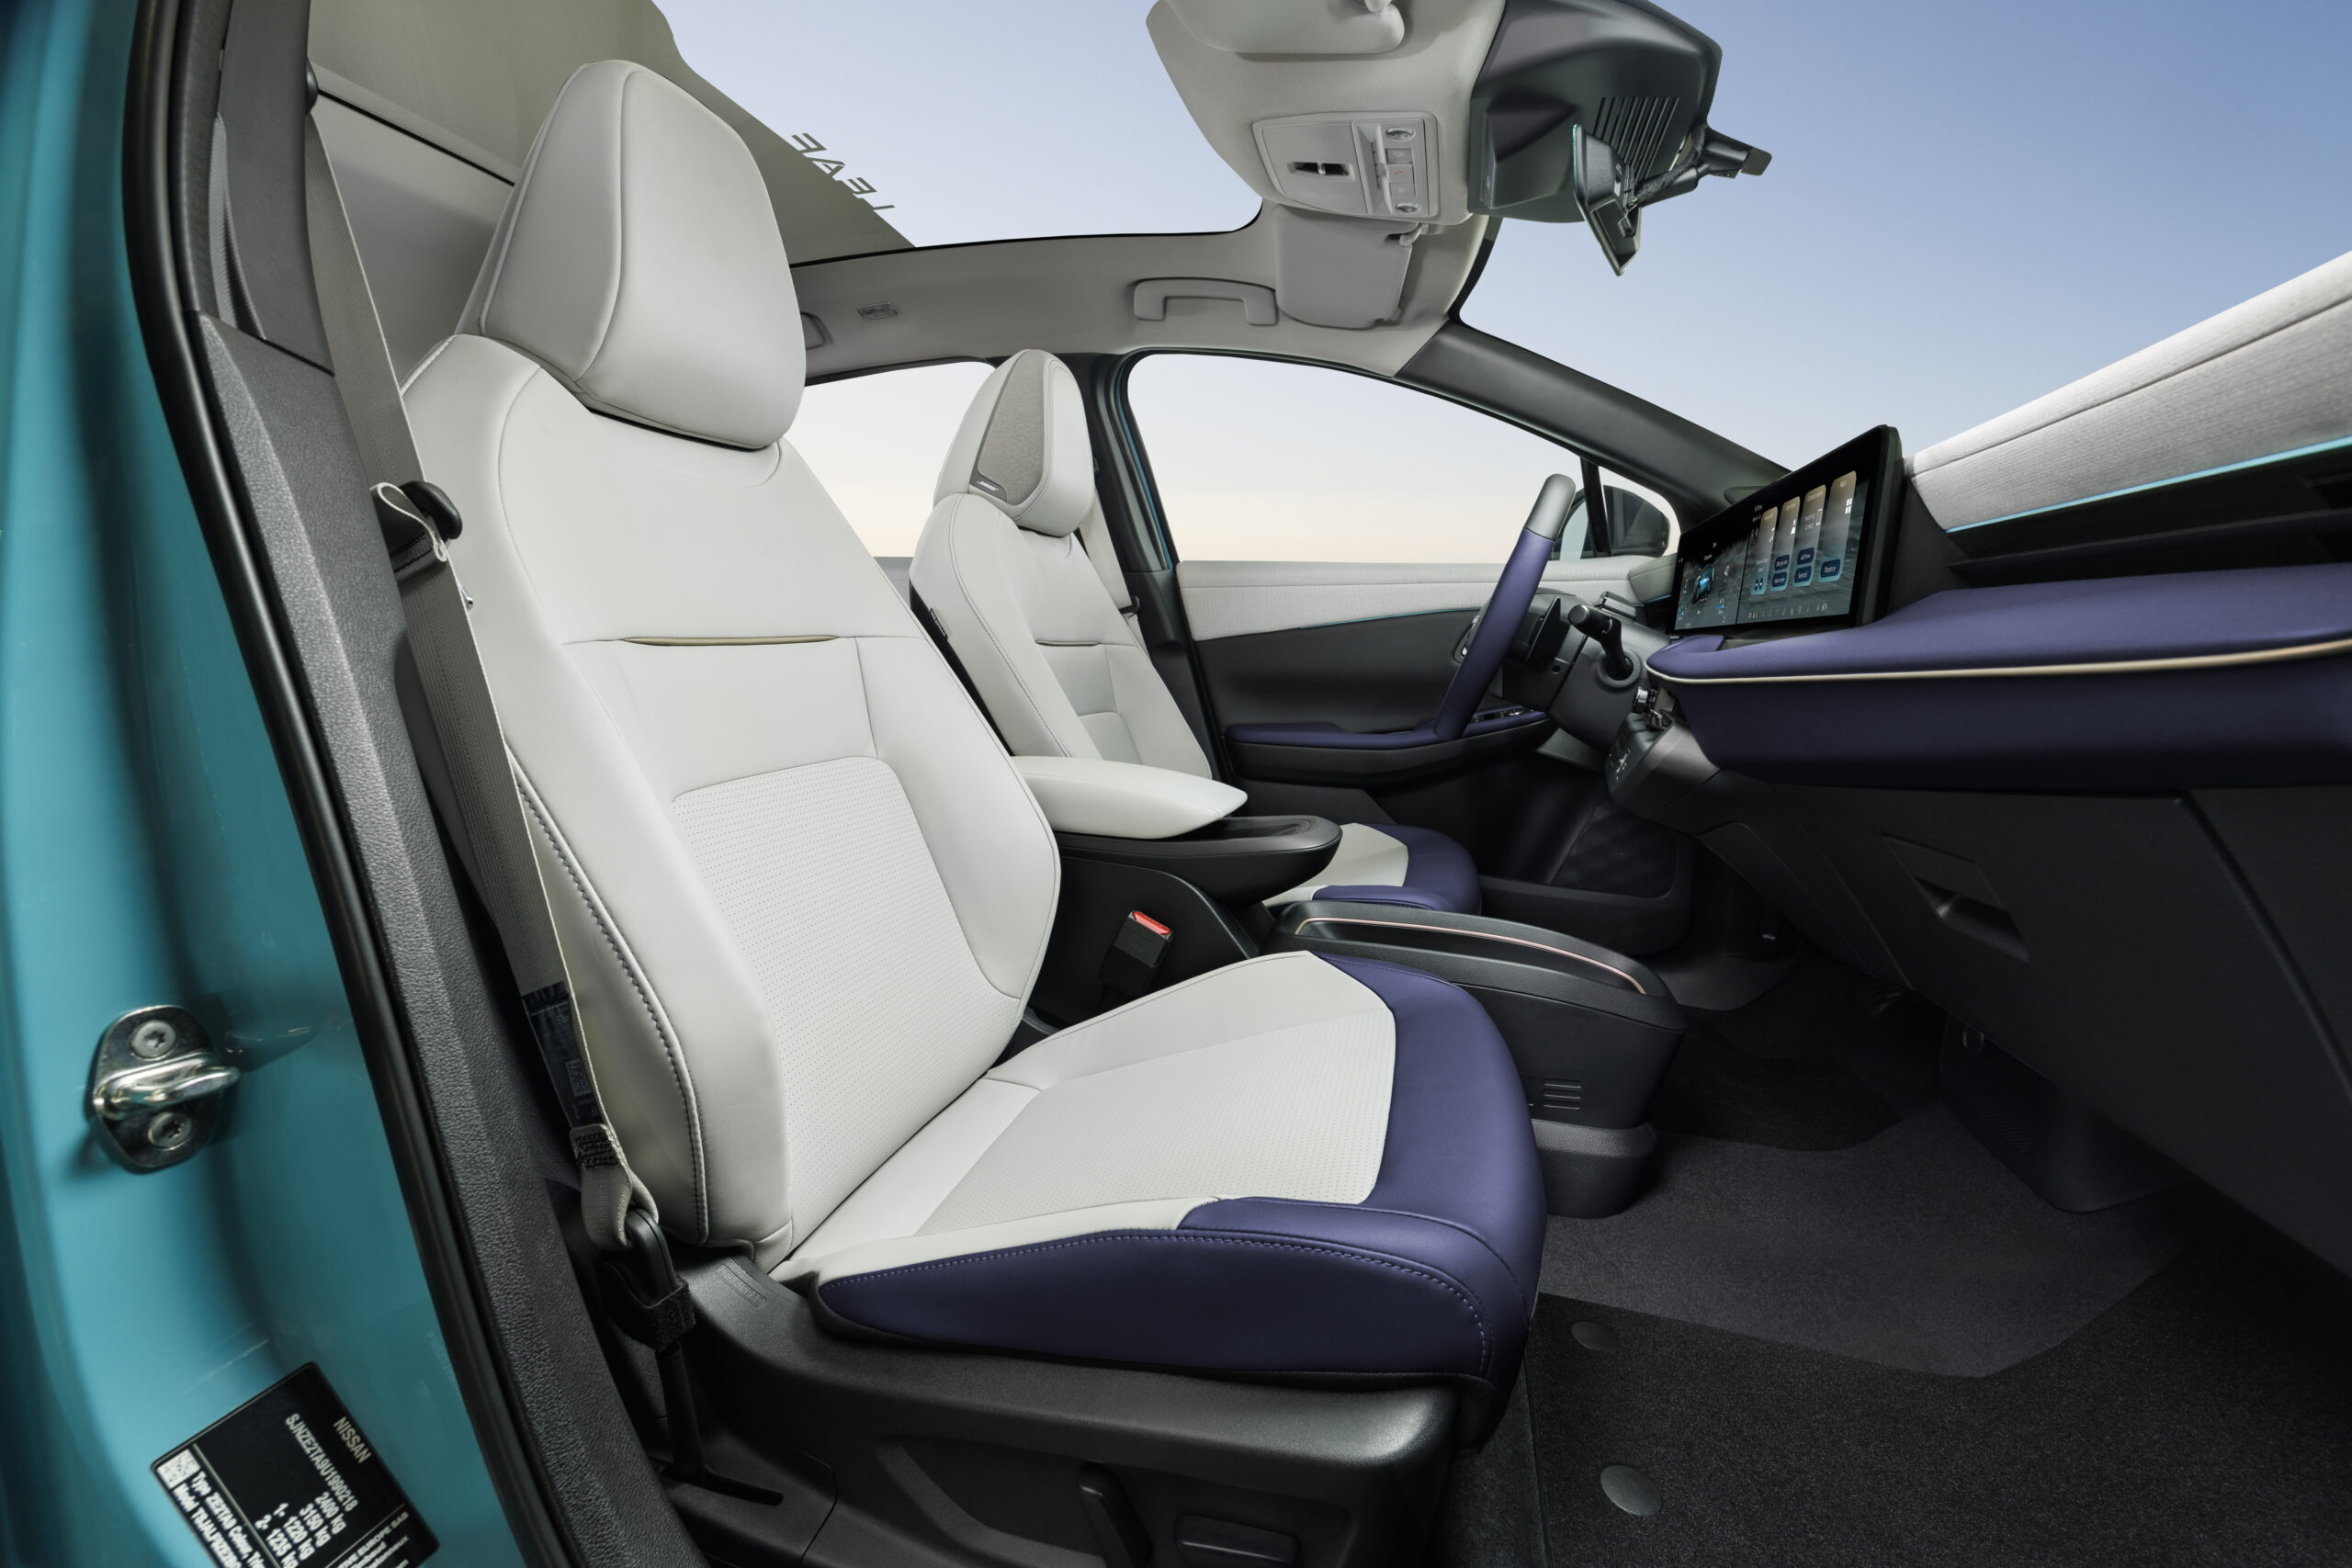
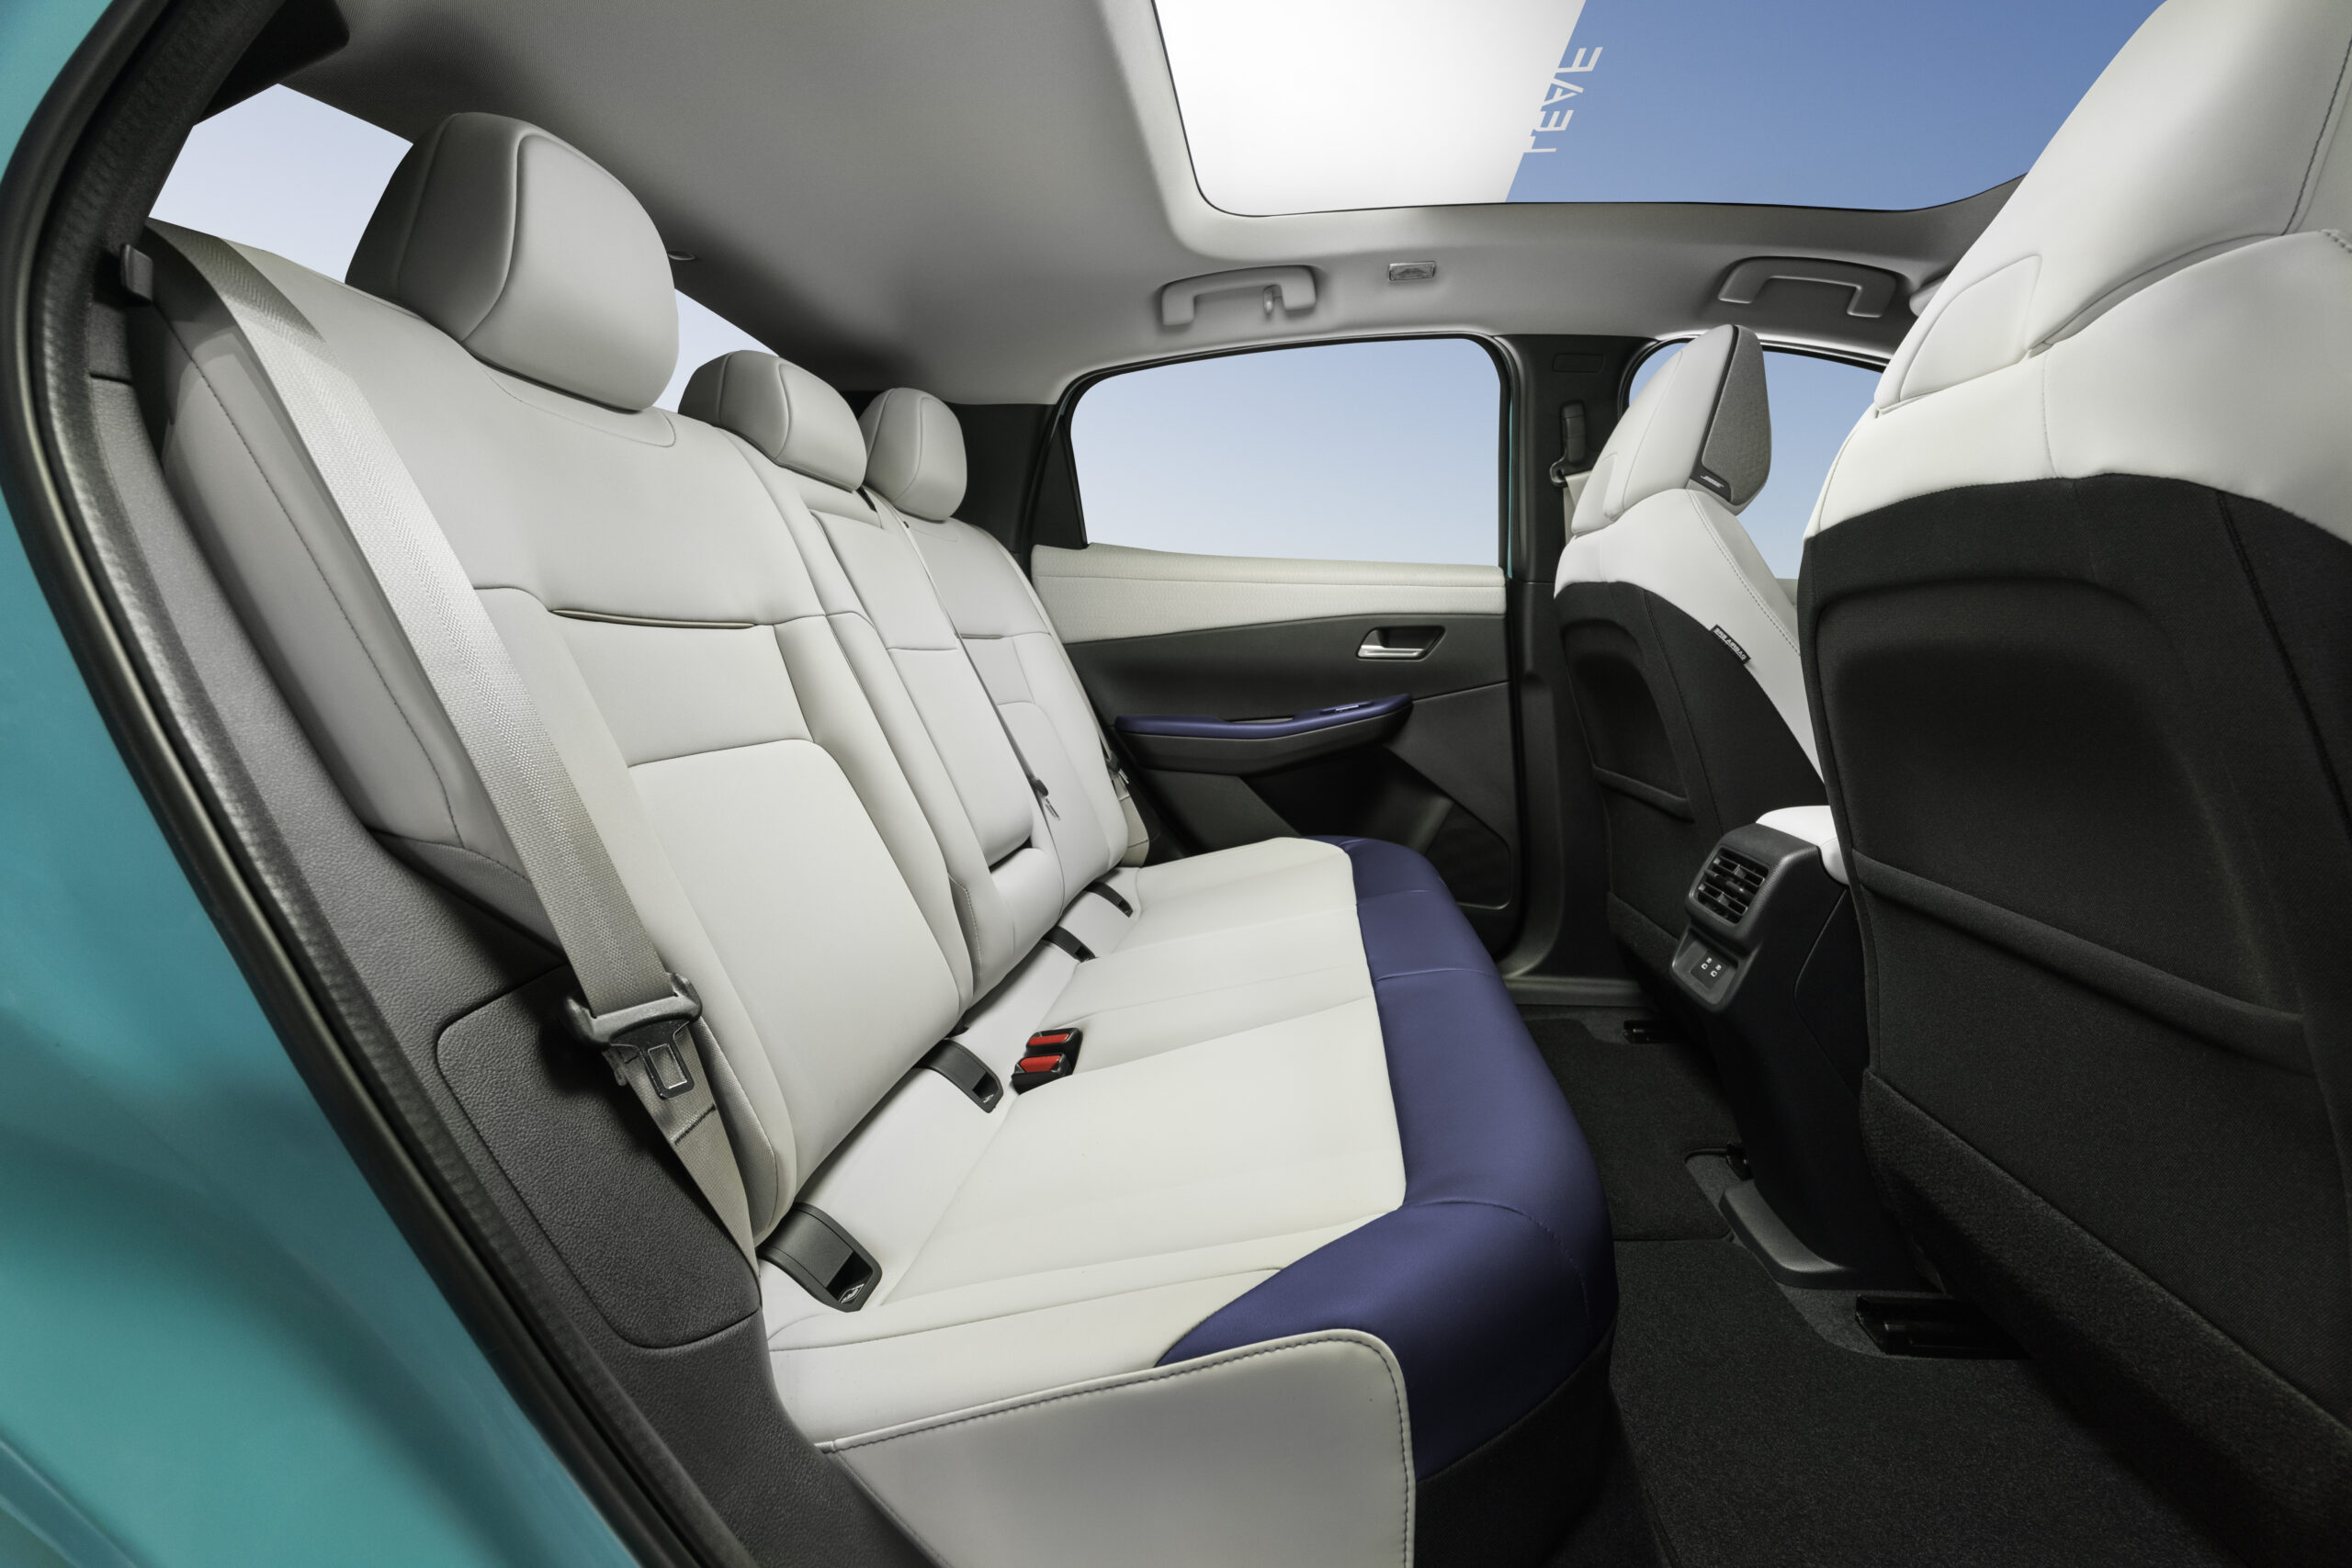
For taller passengers in the rear of the car, the sweeping roofline does cause some issues. Headroom is limited, while legroom is slightly cramped. The panoramic roof does add some extra space up top, but its main job is amplifying the light coming into the cabin. It does this well, giving the Nissan Leaf an airy feel inside.
Source: Nissan
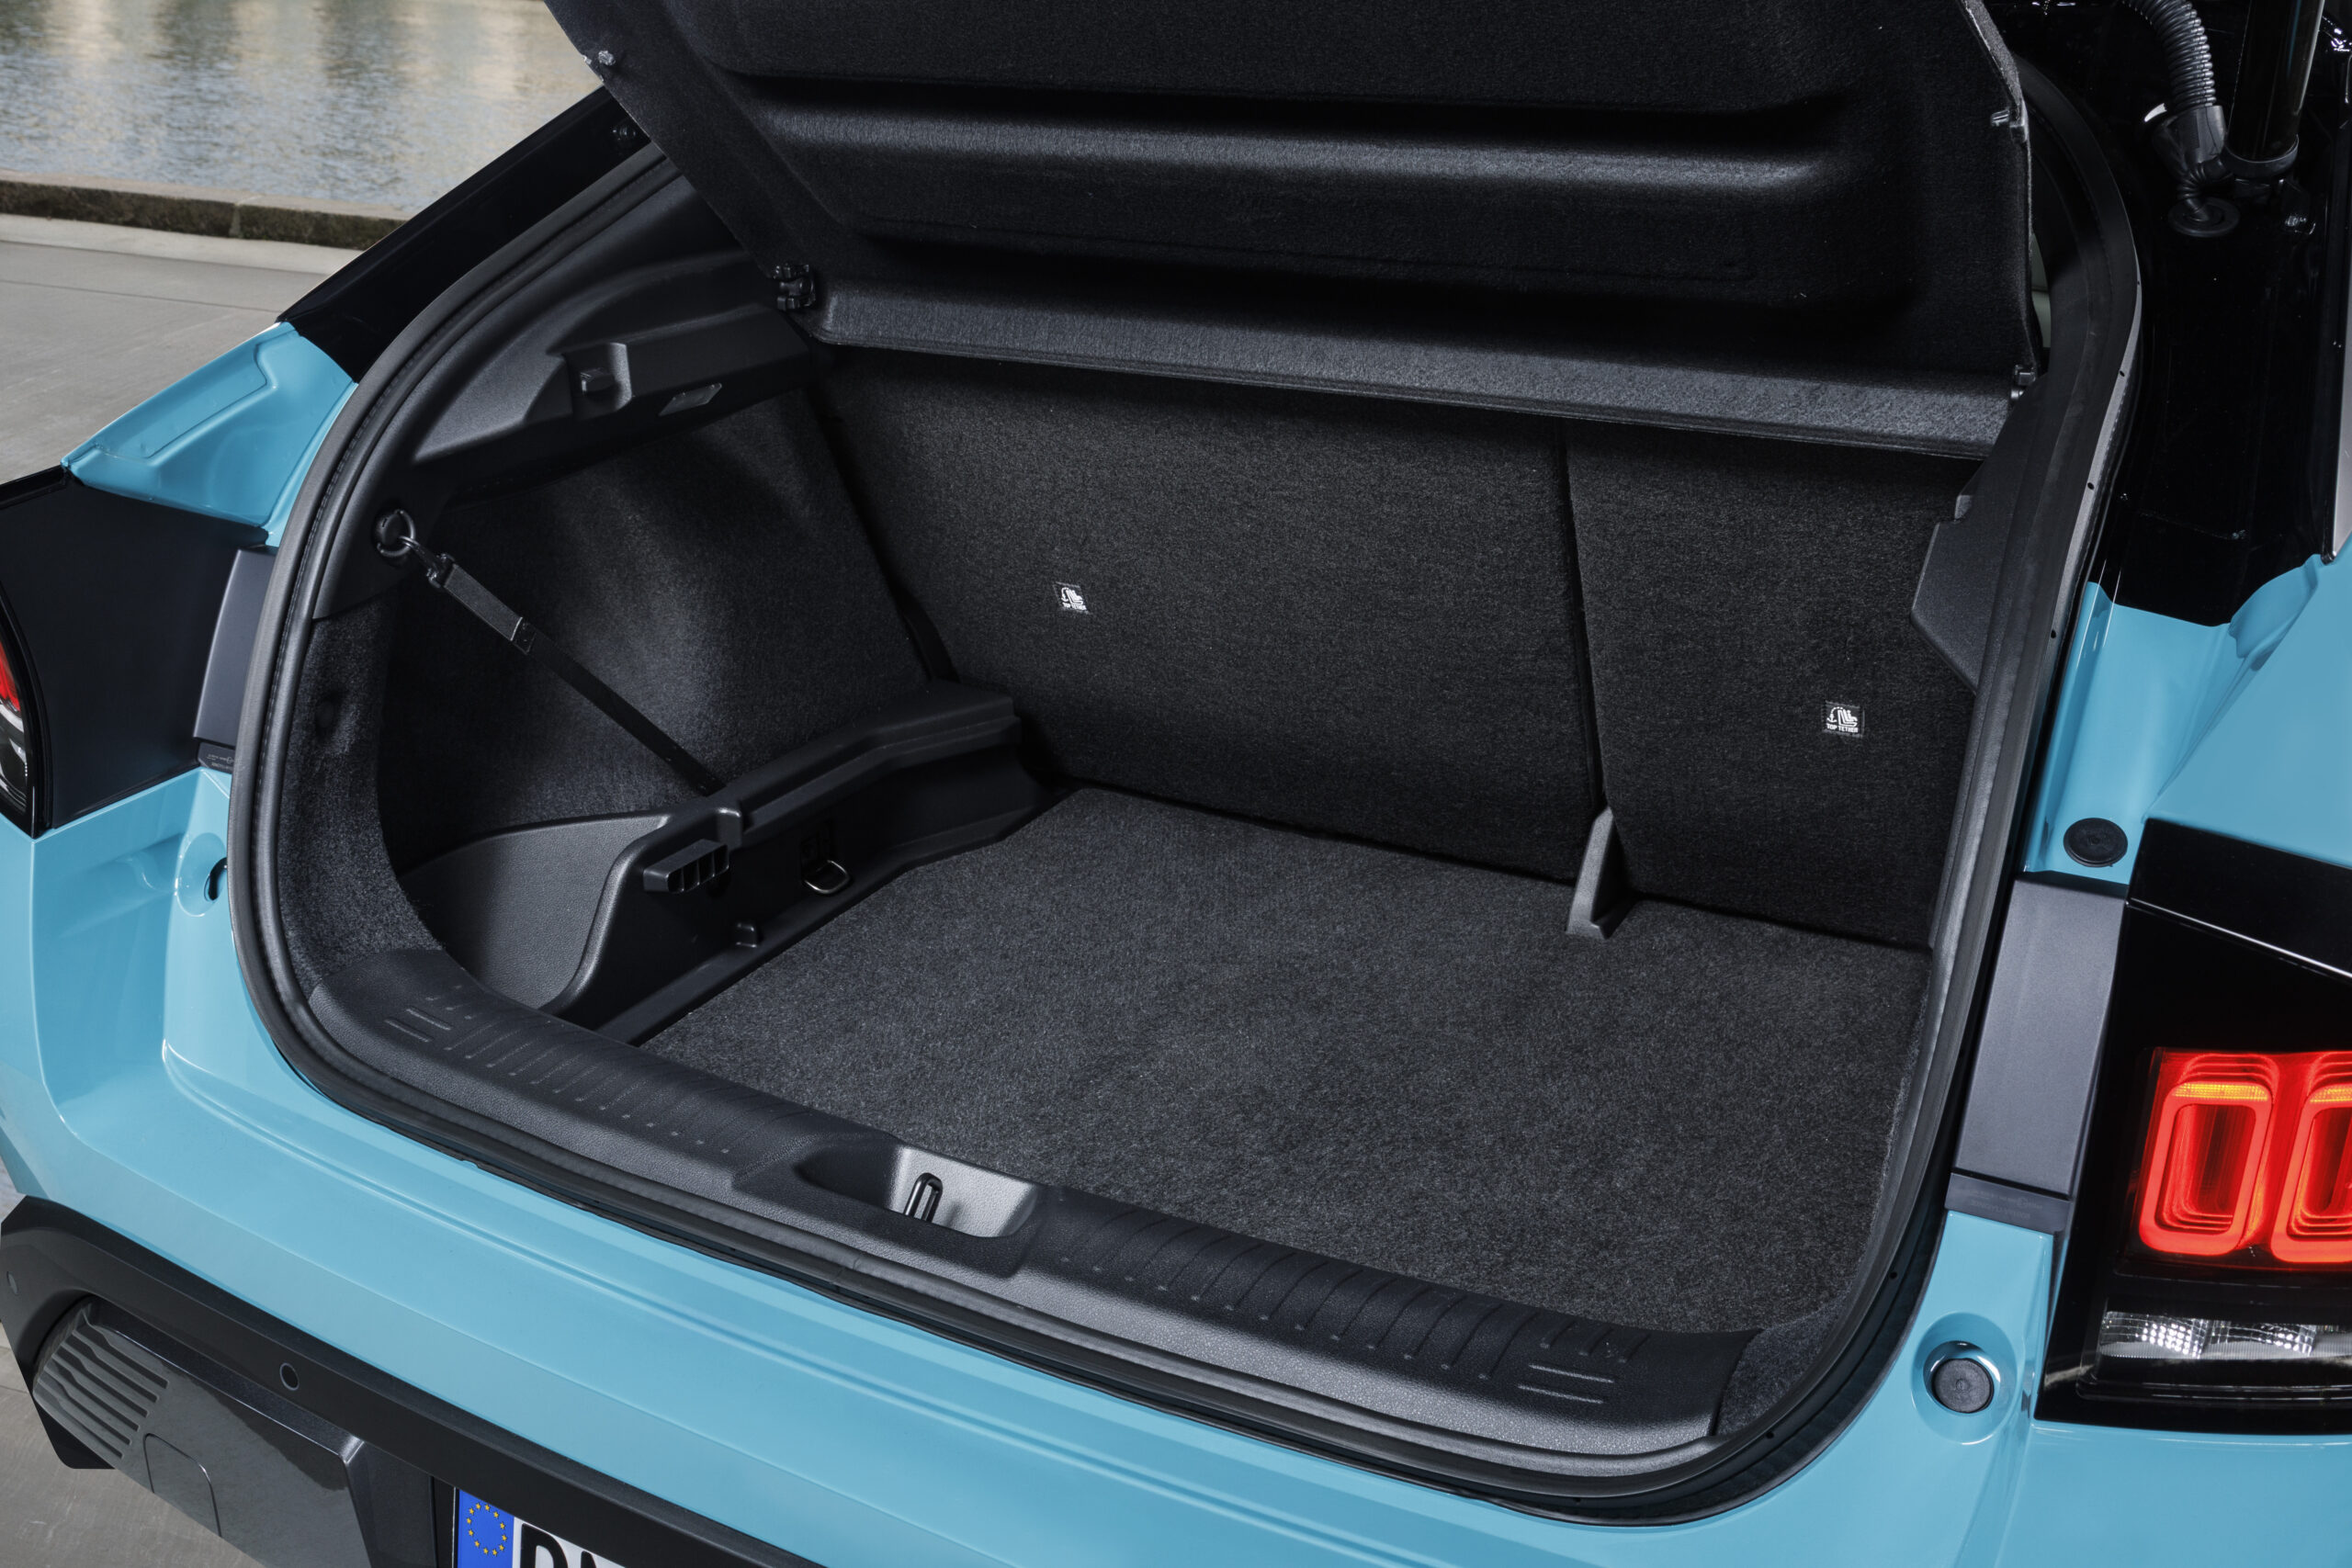
At 437 litres, the boot provides ample storage, although it does fall short of some competitors. The Leaf does have a split floor, meaning cables can be tucked away with ease. This is essential, as there is no frunk included.
The Nissan Leaf on the road
The Nissan Leaf is offered with two battery options: a 52kWh or a 75kWh unit. The smaller unit offers a range of over 440km, while the larger one can go up to 622km, based on WLTP figures. In addition, the larger battery supports up to 150kW DC fast charging.
At the same time, the new Leaf is equipped with vehicle-to-load capability. It can provide up to 3.6kW output for connecting small devices like laptops or cooking gear when out camping.
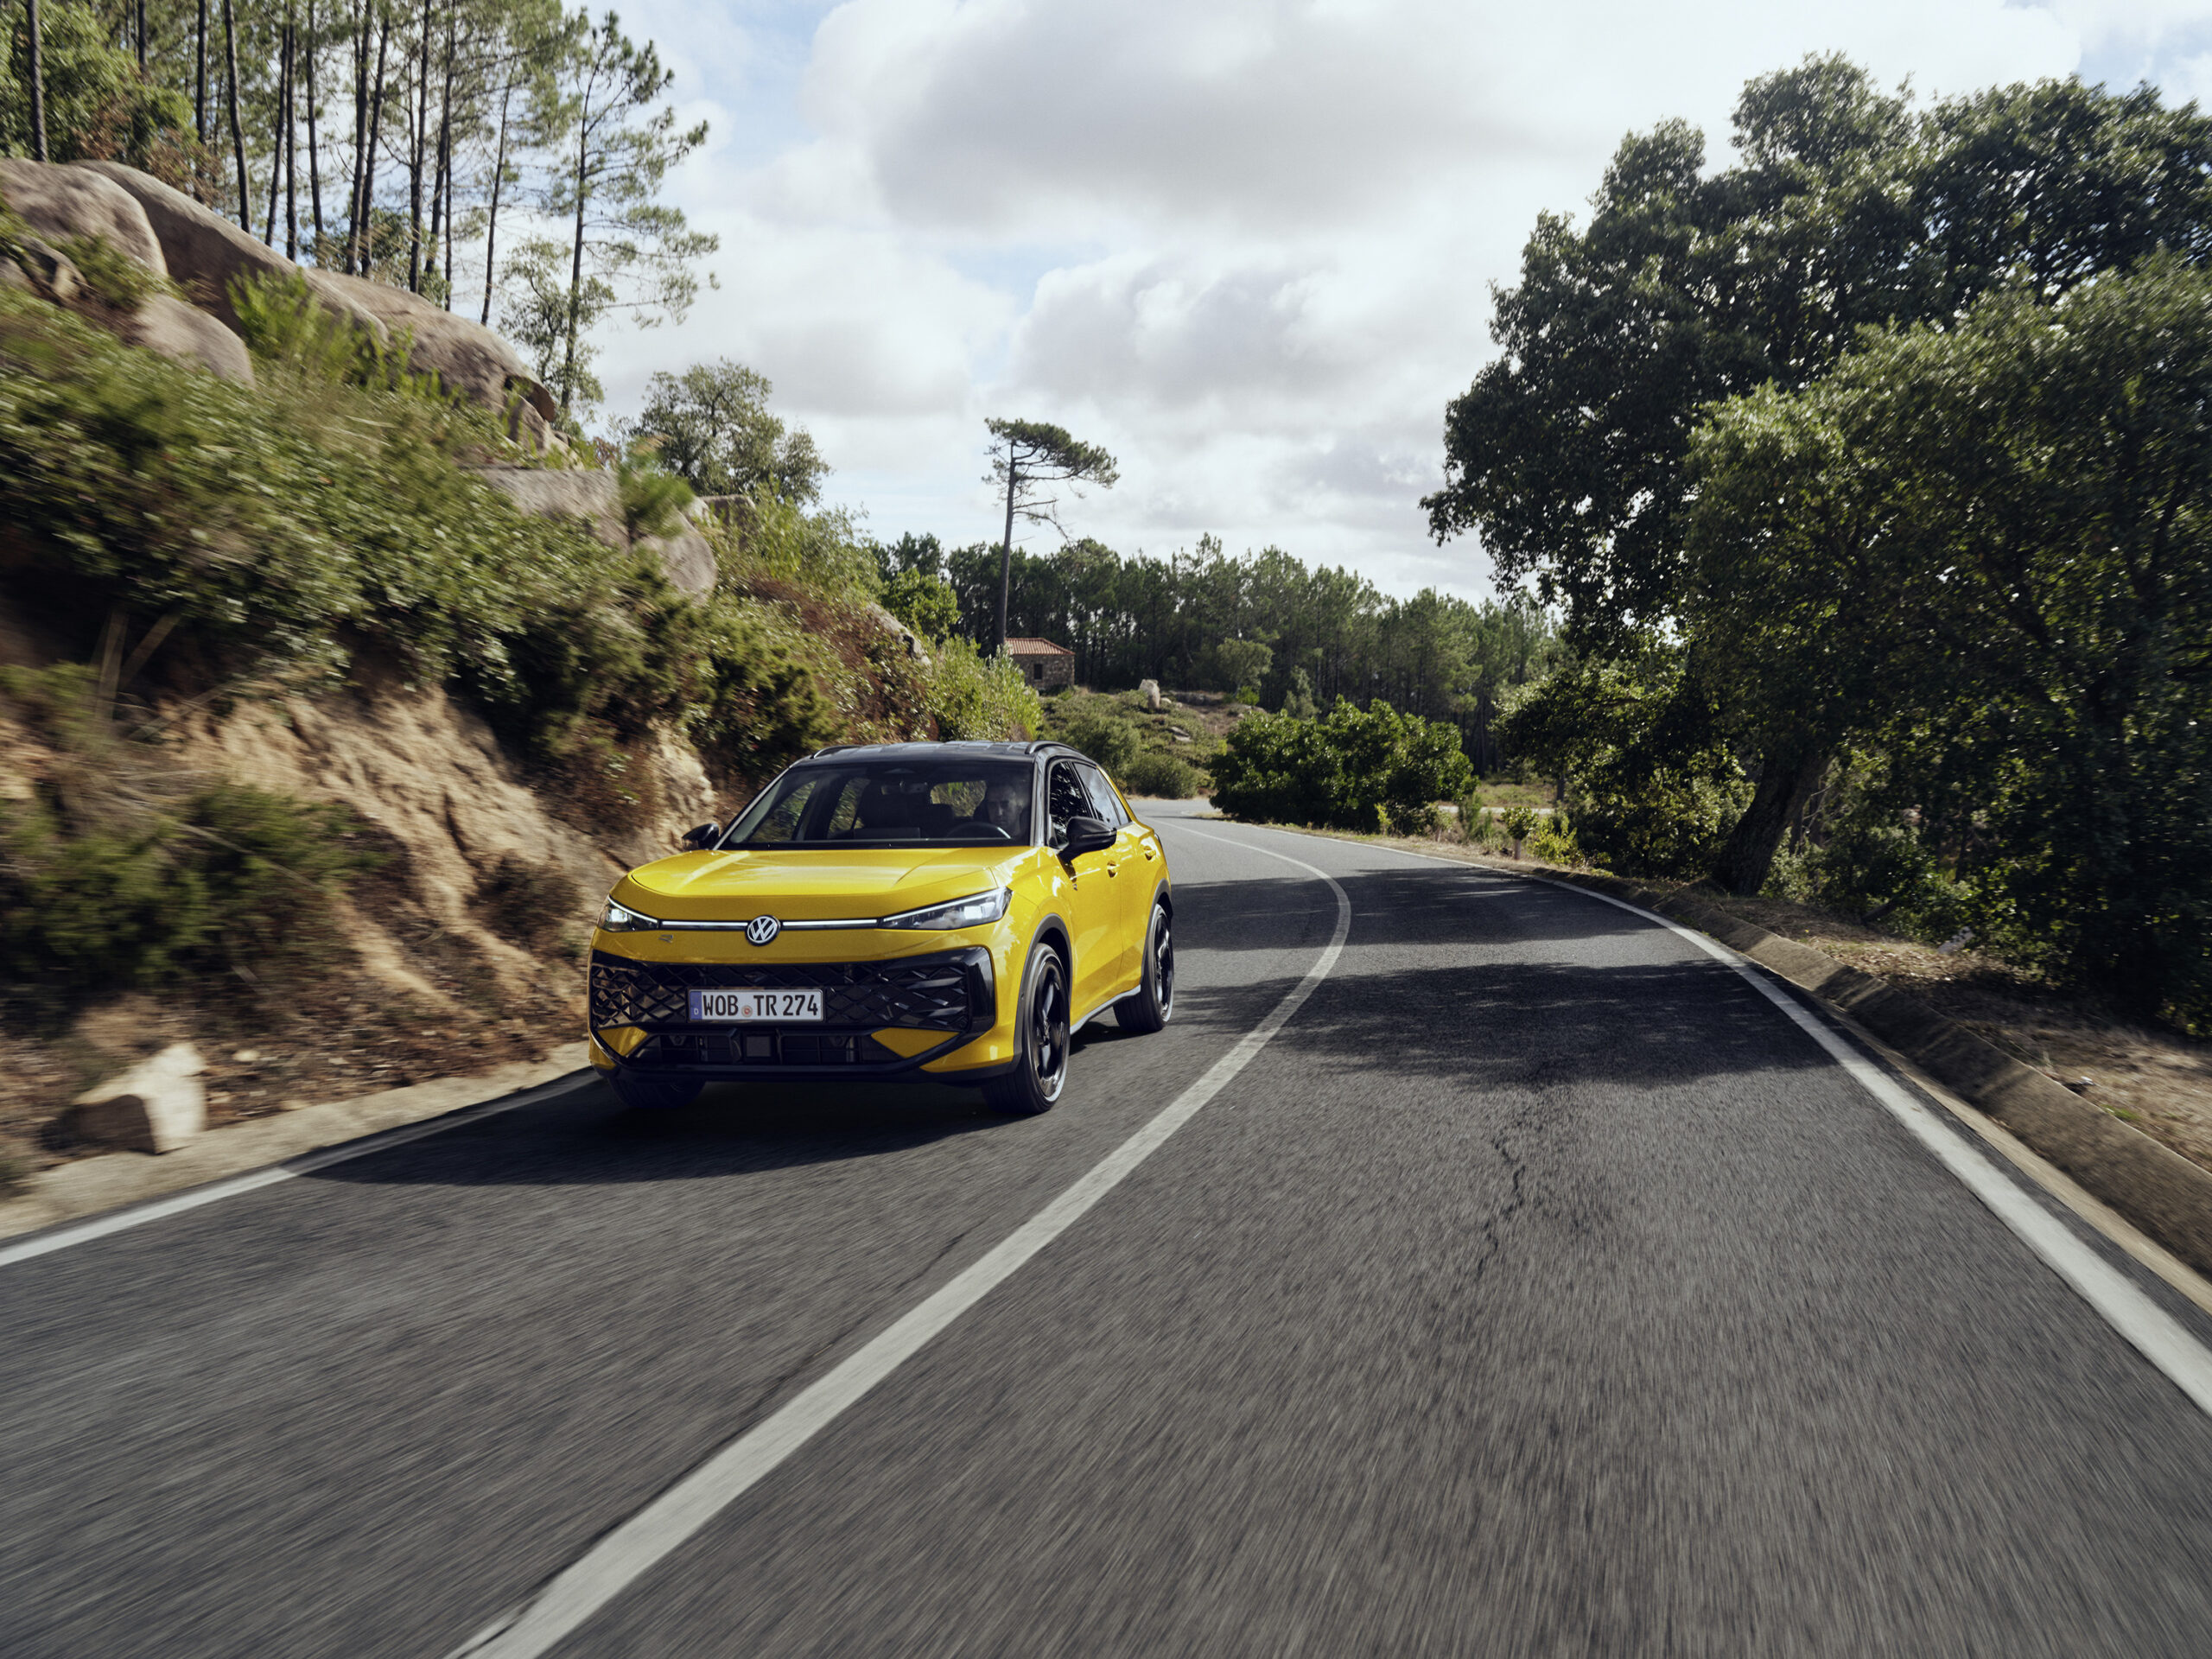
On the road, the model handles well. It is set up for comfort and provides a smooth ride, especially across poorly surfaced roads. However, this does lead to some body roll in the corners. There is also an unwelcome amount of wind noise entering the cabin when driving on motorways.
Acceleration is steady and adequate for both urban and motorway use. The Leaf also features an e-pedal function, allowing one-pedal driving. There is also the ability to use regenerative braking. However, coming to a stop from speed is compromised by a soft feeling from the pedal when pressed.
Overall, the new Nissan Leaf is a capable car, providing comfort and practicality. Its bold design and crossover transformation will ensure that the model can appeal to new customers in its third generation. Nissan’s efforts have highlighted that rather than looking to its past, the Leaf is now positioned for the future.
View the interactive dashboard, which benchmarks the Nissan Leaf in France, Germany, Spain and the UK. The interactive dashboard presents new prices, forecast residual values, and SWOT (strengths, weaknesses, opportunities, and threats) analysis.
New light-commercial vehicle (LCV) registrations in the UK recorded a second consecutive month of growth in May. This was supported by strong demand for electric vans. Andy Picton, specialist residual value analyst at Glass’s, examines the data with Autovista24 content specialist James Roberts.
The UK’s new LCV market recorded growth in May 2026, with registrations rising 3.6% to 23,620 units, SMMT data reveals. This marked the second consecutive month of improvement; the first time this has occurred since October 2024.
However, despite this increase, the performance across the first five months of the year remains slightly behind 2025. A total of 127,046 LCVs were registered between January and May. This was down 0.6%, compared with the 127,875 units recorded over the same period last year.
Market performance in May remained uneven across the different LCV segments. Pickup registrations continued to decline sharply, falling 57.7% to just 1,138 units. This reduced their market share to 4.8%, down from 11.8% a year prior.
Vans under 2 tonnes gross vehicle weight (GVW) saw registrations drop by 24.5%. Meanwhile, those weighing between 2 and 2.5 tonnes GVW recorded a delivery decline of 7.5%.
In contrast, the large-van segment, weighing between 2.5 and 3.5 tonnes GVW, recorded robust growth of 18.6%, reaching 17,380 units. These accounted for 73.6% of all registrations in May. Meanwhile, 4×4 registrations rose 16.2% year on year to 832 units.
Ford models retain LCV dominance
Ford remained dominant in the UK LCV market, with the Transit Custom and Transit securing the top two in May.
The Peugeot Partner claimed third, followed by the Volkswagen (VW) Transporter in fourth. The Maxus Deliver 9 completed the top five.
Further down the top 10, the Renault Trafic and Mercedes-Benz Sprinter took sixth and seventh, respectively. The Land Rover Defender ranked eighth, ahead of the Vauxhall Vivaro and VW Crafter in ninth and 10th places.
Spanning January to May, the Ford Transit Custom continued to lead with 19,570 units registered. It was followed by the Ford Transit with 9,679 units.
Electric van uptake grows but remains below targets
Battery-electric van registrations up to 4.25 tonnes GVW saw solid growth in May, rising 35.5% to 2,345 units. This equated to a market share of 9.8%, up from 7.6% in the same month of 2025.
Despite this progress, diesel still dominated the sector, accounting for 83.9% of all new deliveries. This underlines the enormity of the task ahead in transitioning to zero-emission vehicles (ZEVs).
Over the first five months of 2026, battery-electric LCV registrations reached 12,180 units, an increase of 15.9% year on year. This carved out an overall market share of 9.5%, an improvement on the 8.2% achieved in 2025. Yet the result was still significantly below the UK’s 24% ZEV mandate target for LCVs in 2026.
High upfront vehicle costs, rising energy prices and ongoing charging infrastructure challenges continue to limit faster adoption. This is despite an increasingly broad range of electric LCVs available.
Volkswagen leads electric LCV segment
VW headed the battery-electric LCV market in May, accounting for 35.3% of the registrations. Ford followed with a 25.6% share, while Kia placed third with 13.6%. Maxus and Renault completed the top five manufacturers for the month with 5% and 3.6%, respectively.
Between January and May, VW emerged as the leading battery-electric LCV brand, with a 27.2% share. Ford followed with a 25.6% hold of the market, while Kia took 17.6%.
By model, the VW ID.Buzz Cargo led the way, followed by the VW e-Transporter and Ford E-Transit Custom. The Kia PV5 and Ford E-Transit rounded out the top five.
Lower down the rankings, the Ford E-Transit took fifth with a 7.8% share of registrations. The Maxus eDeliver 9 followed in sixth with a 4.1% share. This was ahead of the Ford E-Transit Courier in seventh with 2.7%.
The Toyota Proace Electric ranked eighth with a 2% share, while the Mercedes-Benz e-Citan finished ninth with a 1.7% share. The Renault Master E-Tech completed the top 10, representing 1.6% of the market.
After five months, the Kia PV5 topped the electric van market, taking a 17.6% share. The Ford E-Transit Custom sat in second with 16.2%, closely followed by the VW ID.Buzz Cargo in third with 16.1%. The VW e-Transporter ranked fourth with an 11.1% share. The Ford E-Transit Courier completed the top five with 5.2%.
Hybrid segment expands rapidly
The plug-in hybrid (PHEV) segment also continued to grow. A total of 1,108 LCVs powered by the technology were registered in May, driven largely by Ford.
The manufacturer dominated this category, with the Transit Custom PHEV leading, alongside the Ranger and Transit Connect variants. VW and Toyota also contributed, with the Caddy PHEV and Corolla Commercial, respectively.
Between January and May, hybrid registrations reached 7,296 units, up 41.9% compared to the same point in 2025. Ford accounted for over 80% of this market, underlining its strong position in electrified LCVs.
Used market remains resilient
In the used LCV market, demand remained strong overall, supported by high buyer engagement at auction. Well-maintained, low-mileage vehicles with a full-service history continue to command the greatest interest and strongest prices.
However, a clear two-tier market is emerging. Older, high-mileage vehicles, particularly those in poorer condition, are proving harder to sell. This is unless priced competitively or improved through refurbishment.
Retail demand showed some softness in May. The influence of bank holidays, school half-term periods, favourable weather and wider economic uncertainty all likely played a part.
Auction activity increases in May
Auction activity strengthened notably in May, with volumes rising by 31.3% compared with April. Average vehicle age fell by 2.2 months to 69.9 months, while mileage declined to 76,583 miles from over 82,500 miles a month earlier.
Average sale prices increased by 6.3% to £8,278 (€9,594). However, first-time conversion rates softened, slipping 2.4 percentage points (pp), to 74%, leaving them 5.7pp below the level recorded a year ago.
Euro 6 vehicles continued to dominate auction sales, accounting for 87.2% of transactions. Meanwhile, Euro 5 models made up 9.5% of the total, down from April.
Medium vans remained the most in demand with a 37.8% share, followed by large vans at 29.1%, and small vans at 21.1%. Pickups and 4x4s accounted for 12% of sales, gaining 0.8pp month on month, and achieved the highest average values at just over £13,550, around £2,300 higher than in April.
Large vans continued to cover the greatest distances, averaging 89,089 miles, up by more than 4,300 miles month on month. This segment also achieved the strongest first-time conversion rate at 77.8%, in contrast to the 4×4 category, which recorded the lowest at 67.7%.
Demand rises for used electric vans
Interest in used battery-electric LCVs at auction is increasing. This looks to be supported by improved market understanding and greater transparency around battery condition. The inclusion of battery health data is helping buyers make more informed purchasing decisions.
This growing confidence translated into a 37% rise in used sales during May. The average age of vehicles sold increased slightly to 38 months, while mileage rose to 21,917 miles. Despite this marginally older and higher-mileage profile, demand for well-presented stock remained strong.
Average sale prices climbed by 3.8% in May to just under £10,300. First-time conversion rates improved sharply to 87%, up from 84.1% in April.
Medium-sized battery-electric vans dominated proceedings, accounting for more than two-thirds of all sales, with small vans taking a further 29%. Small vans also recorded the highest average mileage at close to 23,450 miles, while medium vans delivered the strongest values at just under £11,400. Large battery-electric vans achieved a perfect first-time conversion rate of 100%.
Only 3% of all-electric models sold during the month were older than six years. This highlights the relatively young profile of stock entering the used market.
Retail supply stable but under pressure
The number of used LCVs available in the retail market remained broadly unchanged in May at just under 42,300 units. However, supply was down significantly year on year, falling by nearly 12.7%.
Diesel models continued to dominate listings, accounting for 90.3% of all vehicles on sale. Battery-electric vans represented 5.8% of the market, ahead of PHEVs at 2.2% and petrol models at 1.7%. Manual transmissions remained the preferred choice, featuring in 66% of listings.
Panel vans made up the majority of available stock at 56.9%, while 4×4 vans and pickups accounted for 16.8%. Crew vans represented 9% of listings, followed by minibuses at 3.7%, with dropsides, Lutons and tippers each making up smaller shares.
Meanwhile, 41.1% of vehicles had covered 30,000 miles or less, while 29.2% fell between 30,000 and 70,000 miles. At the higher end, 13.3% had exceeded 100,000 miles.
Pricing remained weighted towards the upper brackets, with 43.1% of vehicles listed at £20,000 or more. A further 38.4% were priced between £10,000 and £20,000, while 15% sat in the £5,000 to £10,000 range. Only 3.5% were listed below £5,000. In total, 74.2% of adverts displayed prices excluding VAT.
White continued to dominate as the most popular used LCV colour, accounting for 47.6% of listings. Grey followed at 18.6%, with black taking 11%, and silver following with 9.6%. Then came blue at 6.4%, and red with 2.1%.
The average vehicle age in the retail market edged up to 56 months. Meanwhile, average mileage fell slightly to just over 55,650 miles. This reflects the underlying demand for younger, lower-mileage stock.
How did residual values (RVs) perform across major European markets in May? How did this influence outlooks? Plus, where are public electric vehicle (EV) charging stations getting a boost? Autovista24 editor Tom Geggus talks through the data in the latest episode of the Automotive Update podcast.
Autovista24 journalist Tom Hooker appears in this week’s podcast episode to discuss value retention trends from seven European used-car markets. Drawing on expert insights, he outlines what to expect in the years ahead.
Then, an exploration of EV Volumes’ latest data on public EV charging infrastructure covering 75 different markets. The duo then considers how the pace of growth was directed by different countries.
May’s Monthly Market Update reveals value declines as a percentage of retained list price (%RV) after 36 months and 60,000km. Meanwhile, new-car list prices rose year-on-year. This trend was recorded in the used-car markets of Austria, France, Germany, Italy, Spain, Switzerland and the UK.
Compared with May 2025, %RVs saw the greatest drop in Italy, where values fell by 3.7 percentage points (pp) to 44.4%. Meanwhile, the smallest decline was recorded in Austria, with a 0.7pp fall to 46.6%. Regional experts also forecast one of the smallest year-on-year drops by the end of 2026.
In contrast, the outlook for Italy foresees the steepest %RV descent of the seven recorded markets. But it is the only location where values are expected to increase once more by 2028. Most other markets expect to see marginal declines by that point.
Electric automotive infrastructure
Public EV charging infrastructure continued to record year-on-year growth in May, according to the latest data from EV Volumes. This details the number of locations a particular connector type can be found. This more accurately reflects the variety of chargers the public has access to.
While there was a year-on-year jump of 25.2% in the number of plug-in points, this confirmed a consistent slowdown. The pace at which new infrastructure has been installed has eased from 81.8% in May 2023.
Representing 83.1% of all charging locations recorded by EV Volumes, China has been a major driver of this result. Following a 110% year-on-year plug-in point expansion in May 2023, this rate decreased consistently to 28% in May 2026.
To put the country’s share into perspective, the next biggest infrastructure location was the Netherlands with a 2.7% share. Other leading locations from Europe included Germany, the UK and France.
More broadly, 524,923 stations were tallied by EV Volumes in Europe, up 15.7% year on year. Meanwhile, the US accounted for 1.8% of recorded plug-in points, with 88,050 locations. This equated to a growth of 7.7% compared with the previous May.
Residual values (RVs) continued to normalise in Europe’s major used-car markets during May. But how does this relate to new-car list prices? Autovista24 journalist Tom Hooker explores the latest trends.
The downward RV trend across Europe’s major used-car markets showed no signs of stopping in May.
RVs as a percentage of retained list price (%RV) after 36 months and 60,000km fell year-on-year across all observed markets. This includes Austria, France, Germany, Italy, Spain, Switzerland and the UK. Furthermore, this decline is expected to continue into 2027 and 2028 for all markets, except Italy.
However, as %RVs followed a uniform pattern across the seven observed countries, new-car list prices did as well. The metric rose year on year, placing further downward pressure on %RVs.
Soaring prices meet slumping values
The three countries with the biggest list price increases were the only ones to see absolute RVs rise. The most pointed example of this was seen in Switzerland. The market witnessed a 7.7% year-on-year increase in list prices to CHF 64,632 (€70,934). Meanwhile, absolute RVs also rose by 4.1% to CHF 27,014.3.
This RV metric saw an even bigger increase of 4.7% in Austria to €22,456.1. List prices grew to €48,190, up 6.3% compared to May 2025. Meanwhile, Spain observed a 4.6% rise in list prices, reaching €37,367, as absolute RVs climbed 2% to €20,357.7.
Conversely, Italy suffered the largest absolute RV drop, with a 6.3% slump year on year to €17,625.7. This was accompanied by the largest %RV decline across the observed markets. The metric plummeted by 3.7 percentage points (pp) to 44.4%. Meanwhile, list prices increased by 1.6%.
The UK endured the second-largest fall in %RVs, down 3.2pp to 47.6%. Absolute RVs in the country also fell by 4.5%, as list prices grew by 1.9%. France and Germany suffered a decline in both %RVs and absolute RVs, too, alongside rising list prices. However, these changes were more marginal.
Austria’s ongoing value retention pressure
Pricing dynamics softened further in Austria during May. The average trade RV of 36‑month‑old cars at 60,000km declined slightly to €22,456.1. This was down 0.6% month on month, but still 4.7% higher year on year.
‘In May, %RVs fell to 46.6%. Compared to the previous month, this represented a 0.3pp decline and translated to a 0.7pp drop year on year. This highlighted ongoing pressure on value retention,’ said Robert Madas, regional head of valuations.
Full hybrids (HEVs) retained the highest trade value at 50.2%, followed by petrol cars at 49%. Then came diesel models with 46.8% and plug-in hybrids (PHEVs) with 43.8%. Battery-electric vehicles (BEVs) improved by 0.8pp compared to April but still held the lowest %RV once again at 39.3%.
The RV outlook remains broadly unchanged. %RVs are forecast to decline gradually over the coming years as supply normalises further. A 0.6% year-on-year decline is forecasted in December 2026, followed by a 0.7% decrease in December 2027.
Slight RV decline in France
‘In France, %RVs decreased slightly in May compared to April. This was mainly driven by PHEVs and BEVs. It is also worth noting that there was a marginally less expensive basket this month,’ noted Ludovic Percier, senior RV analyst for France.
Absolute values of petrol-powered cars dropped slightly compared to April, as they held value well until the middle of 2025. Meanwhile, other powertrains experienced larger decreases. Petrol is still offered as a new vehicle by many manufacturers, while diesel engines are becoming rarer.
‘Diesel-powered cars saw %RVs almost stabilise compared to last month. This is because people are still demanding diesel vehicles on the used-car market. Meanwhile, companies have switched from diesel models to BEVs and PHEVs over the last couple of years. This means the number of new diesel registrations has shrunk,’ said Percier.
HEVs recorded a month-on-month increase in absolute RVs in May. The result was caused by increasing petrol prices and more premium HEV offers on the used-car market. This could be seen in May with a more expensive basket.
Overall, used HEVs remain in demand in France, but carmakers cannot risk adding large price premiums to these models. This would jeopardise their value retention.
Unbalanced offer and demand for PHEVs
‘PHEVs continued to see RVs fall as the supply and demand on the used-car market remained unbalanced. The already established situation continues to impact used-car prices, after many vehicles in previous years were sold to fleets on the back of fiscal advantages,’ explained Percier.
Combined with a high list price on the new-car market, this explains the low RVs. PHEVs offering an electric-only range of below 60km have been most affected. The technology recorded the second-lowest %RVs in May, retaining 47.1% of its list price after three years and 60,000km on average.
BEV %RVs also decreased in May. All-electric models held 35.2% of their value, compared to the 50.1% retention recorded in the overall market.
‘The technology is evolving quickly, now offering higher ranges compared to older models from three years ago. Furthermore, the social leasing scheme for new cars is not helping used-car sales. This is because people can get great deals on new BEVs instead of buying the ones available on the used-car market,’ highlighted Percier.
‘Larger segments will be increasingly impacted in the future, as company and fleet vehicle users benefit from fiscal advantages. These vehicles will come to the used-car market in early 2028,’ he projected.
Mixed market in Germany
Overall, the German used‑car market showed a mixed picture in May, with continued pressure on RVs. After slight price decreases in April, pricing dynamics also remained under pressure last month. The average trade RV of a 36‑month‑old car at 60,000km declined to €21,091.5. This was down 1.1% month on month and 1.7% lower year on year.
‘In retention terms, %RVs fell to 46.1%. This marked a 0.2pp decline compared to April and a more pronounced 1.7pp drop against May 2025. The result highlighted continued weakening in value retention,’ stated Madas.
List prices also softened further, averaging €45,786 in May. This represented a 0.7% month‑on‑month decline. However, prices remained 1.9% higher than a year earlier, which still provided some support to absolute RV levels.
By powertrain, petrol cars continued to lead with a %RV of 47.5%, followed closely by diesel at 47.3% and HEVs at 46.9%. PHEVs held on to 42% of their value, while BEVs remained with the lowest %RV at 36.9%. This remained in line with the powertrain gap observed throughout 2025.
‘Looking ahead, gradual downward pressure on %RVs is still expected as supply normalises further,’ forecasted Madas.
By the end of 2026, %RVs are projected to decline by 1.9% compared with December 2025. Pressure is predicted to ease somewhat in 2027, with a smaller decline of 0.9% expected. This indicates ongoing RV strain, driven by recovering supply, normalising demand, and elevated list prices.
Slowdown in Italy
‘Over the past months, the Italian used-car market has shown signs of a slowdown. This forms part of a negative trend that has been observed in recent years,’ outlined Marco Pasquetti, cluster head of forecasting for Spain and Italy.
Trade %RVs declined by just 0.2pp in May compared to the previous month. However, they remain significantly lower than a year ago.
‘Our analyses indicate that the decline will continue in the coming months, albeit at a progressively lower intensity. The trend suggests a gradual move toward a stabilisation phase. We estimate that the market needs approximately one more year to reach a new equilibrium, with normalisation expected by 2028,’ said Pasquetti.
For certain powertrains, particularly PHEVs and BEVs, this process already appears to be underway. Following a period of sharp corrections, the pace of %RV decline has eased considerably.
‘Compared to April, PHEVs recorded a decrease of 0.3pp, while BEVs remained broadly stable at 28.3%. Considering these dynamics, the 2026 RV outlook has been revised. A year-end decline of 2.8% for PHEVs and 0.9% for BEVs compared to December 2025 is forecast,’ projected Pasquetti.
A different picture emerged for HEVs, which experienced a more pronounced decline than expected. The technology suffered a 4.7pp year-on-year %RV drop and a 0.5pp fall compared to April. Despite this, HEVs remain one of the most resilient powertrains in terms of RV retention.
Spain’s growing interest in electrification
‘Spain’s automotive market maintained a positive trend throughout April. Passenger car registrations increased by 8.5% compared to the same month in 2025, once again surpassing the 100,000-unit mark,’ commented Ana Azofra, regional head of valuations and insights.
This growth continues to be boosted by electric vehicles (EVs), including BEVs and PHEVs. The powertrain group saw a 42.6% rise in registrations during April. In the first four months of the year, BEV and PHEV models accounted for 21% of total registrations, up 6.3pp year on year.
Across sales channels, growth was widespread. The private channel saw the best improvement of 11.2%, followed by companies up 9.2% and rentals up 3.7%. Overall, new-vehicle deliveries continue to reflect a still dynamic demand environment across the sector. As in previous months, this growing interest in electrification is also evident in the used-car market.
Regarding used-car transaction prices, absolute RVs recorded a slight fall of 0.8%. This meant, on average, the metric stood at €20,357.7 for a three-year-old used car at 60,000km.
‘Petrol vehicles followed a similar trend, while diesel models showed a steeper drop of 1.4%. This latter result reflected softer demand for this type of powertrain, which can be linked to rising fuel prices. However, the impact is milder in Spain than in other markets, thanks to government subsidies covering part of fuel costs,’ highlighted Azofra.
‘HEVs showed the same trend as the overall market in May, with BEVs following a similar pattern. However, PHEVs saw a 1.4% decline compared with the previous month. This was more influenced by lower-priced models entering the used-vehicle supply and sales mix than by a price adjustment,’ she noted.
Stable used-car market in Switzerland
The Swiss used‑car market showed signs of stabilising in May when it came to absolute RVs and value retention. After another decrease in April, %RVs showed a modest recovery in May.
‘The average %RV of a 36‑month‑old car at 60,000km increased to 41.8%, representing a 0.4pp rise month on month. Nevertheless, compared with May 2025, %RVs were 1.5pp lower, highlighting that underlying depreciation pressure remains significant,’ said Madas.
In absolute terms, trade RVs rose to CHF 27,014.3, up 1.8% month on month and 4.1% higher year on year. This was supported by continued increases in new‑car pricing.
‘List prices climbed to CHF 64,632, representing a 0.7% month‑on‑month increase and a 7.7% rise year on year. This reinforced the upward price environment,’ stated Madas.
HEVs retained the most value of any powertrain in May by far at 46.6%. Then came petrol-powered cars at 43.1%, diesel-powered models at 41.2% and PHEVs at 39.8%. BEVs continued to be the worst-performing powertrain despite some recovery from April, holding only 36% of their original list price.
Looking ahead, the residual‑value outlook remains unchanged. %RVs are expected to decline gradually as the market continues to normalise. %RVs are forecast to decrease further in the coming years, but at a slower pace. By the end of 2026, %RVs are expected to fall by 1.5% compared to December 2025. A further year-on-year drop of 0.5% is anticipated in 2027.
UK’s varied powertrain performance
‘The UK’s used car market demonstrated consistency in May. The average %RV of a three-year-old car remained broadly level at 47.6% of list price, up 0.1pp from April,’ said Jayson Whittington, regional head of valuations for the UK.
May’s dashboard shows a big variation in powertrain performance. Petrol cars improved, with %RVs rising 0.4pp month on month to 49.1% of list price. Diesel values softened, with RVs falling 2pp to 56.3%. Even after the drop, diesel retained the highest %RV in May.
Meanwhile, electrified technologies saw mixed results. HEVs were stable, edging down 0.1pp to 51.6%. PHEVs weakened by 0.6pp to 43.9%. BEVs dipped 0.3pp to 34.4% and were 3.1pp down compared to May 2025. This reflects the growing volume of BEVs entering used car channels.
Year on year, the market was lower across most fuels, with overall %RVs down 3.2pp. The exception was diesel, which was up 3.3pp versus last May.
‘Recent wholesale activity suggests trading conditions are beginning to slow, likely increasing inventory and leading to a gentle easing in RVs, which is typical behaviour as we approach the summer months,’ concluded Whittington.
New light-commercial vehicle (LCV) sales enjoyed positive year-on-year growth in April as electric van demand increased hand in hand. However, zero-emission vehicle (ZEV) mandate targets remain a distant goal. Andy Picton, specialist residual value analyst at Glass’s, considers the trends with Autovista24 web editor James Roberts.
According to SMMT data, new LCV registrations grew in April by 6.8% year on year. In total, 21,716 vans, chassis, pickups and 4x4s joined UK roads for the first time.
Behind this encouraging overall growth, market performance was mixed. Pickup demand slumped 57.4% to 1,166 units. This ensured volume declines in 11 of the past 12 months, since the changes to benefit-in-kind (BIK) rules. Vans under 2 tonnes gross vehicle weight (GVW) declined 14.4%, while those between 2 and 2.5 tonnes GVW dropped 20%.
On a positive note, the 4×4 sector registered 1,024 units, up 81.6% on April last year. Meanwhile, the large van sector saw demand for vans and chassis weighing between 2.5 and 3.5 tonnes GVW grow by 28.5% over the same period. These 15,561 units accounted for 71.7% of all units registered during the month.
Despite this, the latest registration forecast for 2026 has been revised downwards again. 314,000 units are expected to be delivered this year, down 1,422 units from 2025. The forecast is also 7,000 units down on the first quarter outlook.
Battery-electric vans weighing to 3.5 tonnes are expected to rise from 28,000 units to 35,000 units. This would equate to a 25% increase and a 11.1% market share. This figure, though, remains less than half of the ZEV Mandate ambition.
Wider UK LCV growth
More generally, the latest 2025 Motorparc data covers the overall number of LCVs in use on UK roads. These figures reflect a robust vehicle fleet. However, the move towards zero-emission targets remains sluggish.
Van volumes grew to record levels, up by 1.4% to 5,175,598 units. The most popular vans on the road were the Ford Transit Custom with 554,581 units, followed by the Ford Transit, at 495,971 units. The Volkswagen (VW) Transporter followed with 379,185 units. Of all vehicle types, LCVs have shown the strongest long-term growth, up 29.2% since 2015.
Within the overall total, battery electric vans grew by 34.6% to exceed 100,000 for the first time. In total, 113,256 all-electric models are now in operation across the country, making up 2.2% of LCVs in service.
By region, more LCVs are owned in the South-East than in any other part of the country at 918,991 units, making up a 17.8% share. Of that number, 3.2% were battery-electric vans. This was the highest all-electric share of any region, followed closely behind by the London area with 3.1%.
Ford tops April’s LCV rankings
April saw Ford claim the top two positions, with the Transit Custom and the Transit respectively. The Mercedes-Benz Sprinter took third, the Renault Trafic ended the month in fourth and the Peugeot Partner placed fifth.
The VW Transporter finished sixth, registering 957 units, ahead of the Vauxhall Vivaro in seventh with 952 deliveries. Then came the Land Rover Defender in eighth with 759 units. The Citroen Berlingo secured ninth with 709 units and the Kia PV5 completed the top 10 with 586 units.
April’s electric LCV market analysis
Battery-electric van registrations up to 4.25 tonnes GVW was up 44.7% in April. The 2,439 units sold resulted in a monthly market share of 11.1%, up from 8.3% 12 months prior. However, nearly 83% of all vehicles registered in the month were diesel, highlighting the scale of the task at hand in transitioning operators to ZEVs.
Across the first four months of the year, 9,835 units have been registered, up 12% compared to the same period of 2025. This ensured a 9.4% market share, well below the ZEV mandate target of 24% for this year.
Electric LCV sales by brand
Ford accounted for over a quarter of all new battery-electric vans registered in April. Kia followed behind with 24%, and VW in third with a 22.9% share. Some distance behind was Maxus in fourth with a 6.1% market share and Vauxhall in fifth with a 5.5% hold.
Further down the list, Toyota claimed sixth position with 106 units and a 4.3% market share. Meanwhile, Mercedes-Benz finished seventh with 91 registrations and 3.7% of the market. Renault ended the month in eighth, selling 72 units, and with it, a 2.9% market share. Farizon claimed ninth with 26 units and a 1.1% hold. Citroen rounded out the top ten, registering 16 units and taking a 0.6% market share.
By range, the Kia PV5 led the way for the second month running, accounting for 24% of all battery-electric vehicle (BEV) registrations. The Volkswagen ID. Buzz Cargo followed with a 15.4% hold. Meanwhile, the Ford E-Transit Custom and e-Transporter ended up third and fourth, with shares of 15% and 7.5%, respectively. The Ford E-Transit claimed fifth, with 7% of all registrations.
Lower placed rankings saw the Vauxhall Vivaro Electric and the Maxus eDeliver 9 finish joint sixth with 109 units. The Ford E-Transit Courier was eighth with 100 units and the Mercedes-Benz e-Citan was ninth with 62 units. Completing the top 10 was the Renault Master E-Tech with 57 units sold.
The plug-in hybrid (PHEV) van segment saw five different manufacturers register a combined 1,033 units. Ford led the way with 484 Transit Custom vans, 198 Ranger pickups and 122 Transit Connect PHEVs. Toyota followed with 124 Corolla Commercial vans, ahead of 98 VW Caddy PHEV vans. Dacia registered six Duster Cargo vans and LEVC delivered one new VN5 van.
Between January and April, of the 6,188 hybrid LCVs registered, Ford claimed a dominant 83.4% market share. Toyota followed with a 10.6% share, ahead of VW with a 5.8% hold.
Used LCV market overview
The anticipated influx of de-fleeted stock from fleet, rental and finance providers following the March plate change did not materialise. These vehicles are likely to start being de-fleeted in the next month or so.
Good quality stock is still available, with elevated levels of buyer engagement at most auctions. Sub-two-year-old offerings can struggle against competitive deals for new ‘26-plate vehicles.
Despite this, two-to-four-year-old ready-to-retail stock with typically less than 70,000 miles continues to attract plenty of attention. Buyers are willing to pay strongly for the right vehicle and a full-service history. Additionally, there has been strong interest in older, higher-mileage stock offered in fair condition and realistically priced.
Stock age increased in April
Factors such as ageing stock in poorer condition meant a drop in the number of vehicles sold at auction in April. The Easter holidays and good weather also influenced the decline in sales.
Overall average age increased from 69.7 months to 72.1 months. Average mileage also increased, rising from 73,206 miles to 82,548 miles. Elsewhere, first-time conversion rates worsened by 2.8% to 76.4%, 3.4% lower year on year. Finally, average sales prices fell by nearly 9% over the month
Euro 6 vehicles accounted for 85.3% of sales in April. Euro 5 sales made up 11.4%, up 0.6% on March. Medium vans led demand with 36.8% of sales, followed by large vans at 29.5%, and small vans 22.3%.
The 4×4 Pickup sector took 11.2% of the market, an increase of 0.5% on March. This sector commanded the highest average sales price at just under £11,250 (€12,984). This was a £3,250 decrease on the average paid in the previous month.
Large vans covered more distance than any other LCV type in April at an average of 84,734 miles. This was up 13,735 miles compared to March. The small van sector returned the highest first-time conversion rate at 79.5%, while the lowest was achieved in the 4×4 sector at 71.1%.
Increase in used electric LCV demand
Despite the prevailing preference for petrol and diesel, there has been a noticeable increase in the volumes of used electric LCVs available at auction. Of those sold, many have cited the inclusion of battery health data in the vehicle description as a big step forward. This is giving consumers a more informed picture during transactions.
Electric van performance in April was mixed. On the one hand, overall sales fell by a third. However, those that sold were a lot younger and with significantly fewer miles. Average stock age nearly halved from 69.5 months to 35.8 months. Meanwhile, average mileage fell from 51,166 miles to 20,712 miles.
This younger age-mileage profile resulted in the average sale prices rising by £4,000, from just under £5,900 to nearly £9,900. First-time conversion rates rose nearly 10%, from 74.3% to 84.1%. Sales of medium-sized electric vans proved popular, accounting for 55.5% of all sales in the month. Small vans took a 41.3% share and large vans made up 3.2% of overall transactions.
The highest mileages were covered in the large van sector, averaging over 74,850 miles. The lowest mileage was recorded in the medium van sector at 16,500 miles. Medium-sized electric vans attained the highest average sales price at over £11,500, while the highest first-time conversion rate of 100% was achieved in the large van sector. 44.4% of all electric vans sold in April were between two-to-four years of age.
Retail increases recorded
The number of used vehicles observed for sale in the retail market in April increased by 3% to just over 42,400 units.
Diesel models made up the bulk of those on sale at 90.7%, up 1.1% on the previous month. Battery-electric LCVs accounted for 5.3%, ahead of PHEVs 2.1% share, and petrol’s 1.6% hold. LCVs with manual gearboxes accounted for 66.4% of retail sales.
Panel vans accounted for 56.1% of all LCVs on sale, 13.4% were 4×4 pickups, and 9.2% were crew vans. Minibuses made up 3.9% and dropsides claimed a 1.7% share. Luton vans and tippers represented 1.7% and 1.5% of sales, respectively. Of all the LCVs on sale, 40.8% had mileages of 30,000 miles or less. 29.0% had mileages between 30,000 miles and 70,000 miles, while 13.5% had mileages above 100,000 miles.
43.5% of vehicles listed were priced at £20,000 or more, 38.1% were priced between £10,000 and £20,000, while 14.8% sat in the £5,000 to £10,000 range. Vans priced below £5,000 accounted for 3.6% of the market. Just over 73.8% of all adverts showed the vehicle on sale for a price excluding VAT.
White vans led in popularity, accounting for 47.9% of all listings. Grey represented 18.4% of sales and black took a 10.8% share. 9.7% of all vans listed were silver, 6.2% were blue and 2.1% were red. The average vehicle age for April increased by three months to 55 months. Average mileage also rose, up 6.5% to just under 56,200 miles.
Which models were the fastest-selling in key European used-car markets? What happened with other demand indicators for used cars? Autovista24 special content editor Phil Curry discusses all this and more in the Automotive update podcast.
This episode takes a deep dive into key European used-car markets, including the performance of residual values (RVs). Also, how is Australia adapting its electric vehicle (EV) incentives for the coming years?
Fastest-selling used cars
The latest Autovista24 Monthly Market Update revealed that trade RVs remained broadly stable across Austria, France, Germany, Italy, Spain, Switzerland and the UK. While there was an overall trend of decline compared with March, value drops were mostly marginal.
The data presented in the latest report also revealed which models were the fastest selling in each market. This is based on the average days to sell, between a car entering the market and finding a new owner.
Both the Tesla Model Y and Cupra Formentor topped local used-cars charts in two of the seven analysed markets. The US model moved quickly in Austria and Germany, while the Spanish brand topped the French and UK tables.
The Dacia Sandero placed in the top five of four markets, topping the chart in Spain. In Italy, the Toyota Yaris Cross led the fastest-selling cars table. The Japanese model also placed in the top five for Austria and Spain. The SEAT Leon topped the market in Switzerland, the only market where it appeared in the top five.
Other notable performances included the Volkswagen Polo, which appeared in the tables of Austria, France and the UK. Toyota continued to prove popular, with its Corolla appearing as one of the fastest sellers in France and Spain. The Toyota Yaris also made the top five in France and Italy.
Can electric cars benefit from rising prices?
ACEA has argued that energy market volatility is strengthening the case for accelerating away from fossil fuels in road transport.
‘A technology-neutral decarbonisation strategy that embraces electrification and includes renewable fuels is essential. It is key to safeguarding Europe’s resilience, protecting consumers from price and supply shocks, and delivering a successful transition to climate‑neutral mobility,’ commented Sigrid de Vries, ACEA Director General.
The industry body has indicated a need for policy action in two areas. This includes making electricity the most affordable source of energy. Achieving this requires lowering the cost of energy used to charge EVs. This can help drive consumers and businesses into zero-emission transport.
ACEA also suggested that renewable fuels should be incentivised, based on their carbon content. Short-term measures to lower fuel prices do not currently distinguish between fuels based on their makeup.
Australia extends EV incentives
The Australian government has extended its EV incentive programme. The Electric Car Discount (ECD) was first introduced in 2022 and will be rolled out in three phases. The scheme offers a tax rebate when employees use salary sacrifice to cover the leasing costs of an EV.
Government analysis revealed the programme led to an estimated 64,000 additional battery-electric vehicle (BEV) sales between 2022 and 2025.
Phase one of the extension will run until the end of March 2027. This will extend exemptions from the country’s Fringe Benefits Tax (FBT) on the portion of salary used to pay leasing instalments.
The second phase will run from 1 April 2027 to 1 April 2029. During this time, the FBT exemption will only apply to EVs with a purchase price of up to AUS $75,000 (€46,252). This measure aims to encourage manufacturers to offer more affordable BEVs in the Australian market.
EVs costing more than AUS $75,000, but below the luxury car tax threshold, will qualify for a 25% discount on payable FBT. The third phase starts on 1 April 2029, when all EVs below the luxury car tax threshold will qualify for a 25% discount on payable FBT.
Residual values (RVs) remained broadly stable across European used-car markets in April. But what did other metrics reveal in Austria, France, Germany, Italy, Spain, Switzerland, and the UK? Autovista24 editor Tom Geggus examines the market data.
Passenger car values in key European markets remained relatively stable in April. While there was an overall trend of decline compared with March, value drops were mostly marginal.
The UK saw the largest decline in absolute RVs, down 2.3% month on month to £15,460 (€17,924). With the exception of Austria’s 1.8% fall to €22,623, nearly all other observed markets recorded drops under 1%. Spain was even able to record a 0.9% increase in absolute RVs compared with March.
RVs presented as a percentage of retained list price (%RV) after 36 months and 60,000km also remained stable in April. Compared with March, the UK once again saw the largest drop, from 48.4% to 47.4%.
Declines in %RVs were more substantial compared with April 2025. Italy recorded the largest decline, down 3.8 percentage points (pp) to 44.6%. Meanwhile, all markets saw list prices and active-market volume indices (AMVI) climb year on year, putting pressure on %RVs.
Austria sees more momentum
Austria’s sales‑volume index (SVI) for two‑to‑four‑year‑old passenger cars continued its upward trend in April. The metric increased by 11.7% compared with March, while demand was 12.2% higher year on year.
‘This underlined a clear improvement compared to early 2025 and confirms that market momentum has only strengthened,’ said Robert Madas, regional head of valuations.
Supply conditions eased slightly. The AMVI fell by 1% month on month. Nevertheless, stock levels remained 1.2% higher than a year earlier. This indicates that supply remains broadly balanced and above last year’s level despite the marginal monthly contraction.
Turnover speed improved again in April. The average time needed to sell a used car declined to 66.5 days, a month-on-month improvement of two days. Compared with April 2025, however, turnaround times were 1.7 days longer.
Full hybrids (HEVs) took the lead in turnover speed at 53.1 days, marking a significant improvement compared to March. The Toyota Yaris was a major motivating factor behind this trend. Then came diesel models, needing 63 days to sell on average.
This was followed by battery-electric vehicles (BEVs) at 67.7 days, after a significant improvement compared with March. Next were petrol cars, taking an average of 68.5 days to sell, and plug-in hybrids (PHEVs) at 73.1 days.
Softer pricing dynamics
Pricing dynamics softened in April. The average absolute trade RV of 36‑month‑old cars at 60,000km declined to €22,623. This was down 1.8% month on month but was still 5.4% higher than in April 2025.
Meanwhile, %RVs fell to 46.9% in Austria. This was down 0.4pp on March and 0.7pp on April last year, highlighting renewed pressure on value retention. List prices also edged lower, averaging €48,278 in April. This represented a 0.9% month‑on‑month decline, though prices remained 7.1% higher than a year earlier.
HEVs retained the highest %RV at 51.1%, followed by petrol cars at 49.6%. Then came diesel models with 46.9% and PHEVs with 44.2%. BEVs held the lowest %RV once again, at 38.5%.
Austria’s RV outlook remains broadly unchanged. %RVs are forecast to decline gradually over the coming years as supply normalises further. In December 2026, a 0.5% year-on-year decline is forecast. A 0.7% decrease in 2027 is expected to follow.
Value stability in France
RVs were stable in France during April, maintaining the levels recorded at the end of 2025. A slightly more expensive basket contributed to lower trade %RVs. The average number of days needed to sell a 24-to-48-month-old car was stable overall as well.
Values of petrol-powered models followed the general market trend. The fuel type has seen mostly stable RVs, even as other powertrains experienced larger decreases. Additionally, petrol cars are still widely offered by many manufacturers while diesel cars are becoming rarer.
‘After seeing values fall marginally in previous months, diesel-powered cars saw RVs pick up slightly in April. The fuel type is still in demand on the French used-car market, even as new sales fall,’ commented Ludovic Percier, senior RV analyst for France.
HEVs saw absolute trade RVs remain stable in April. More manufacturers are now featuring the technology in their model lineups. There are increased numbers of these powertrains in the used-car market, with most new entrants coming from mainstream brands.
Toyota has consistently led the French used HEV market, with model reliability boosting RVs. Overall, used HEVs are still in demand in France, but carmakers cannot risk increasing their price premiums. This would jeopardise the value retention of these models.
Supply and demand imbalance
PHEV values kept falling in April as supply and demand on the used-car market remained imbalanced. Previously, new PHEVs with high list prices were sold to fleets on the back of fiscal advantages. This continues to negatively impact the value retention of these used models as they come back to market. Vehicles offering an electric-only range of below 60km have been most affected.
PHEVs were the second slowest-selling powertrain in April, taking 69.1 days on average. This increased compared to March, as more models came back from leasing with smaller electric ranges than newer models.
BEV values were stable. The technology is evolving quickly, with driving ranges extending compared to models from three years ago.
On average, BEVs spent 80.3 days in stock during April, compared with the market average of 66.6. The powertrain retained 35.6% of its new car list price after 36 months and 60,000km. This was compared to the overall market’s 50.2%.
France’s social leasing programme is not helping used-car sales, as buyers opt for new models instead of pre-owned ones. The upper segment will be more impacted in the future as company and fleet vehicle users benefit from fiscal advantages. These vehicles will come to the used-car market in early 2028.
Market liquidity improves in Germany
Used‑car demand in Germany continued to improve in April, building on the recovery seen in the first quarter.
The SVI increased by 9.7% compared with March. However, the demand metric remained below last year’s level, with the index 5.5% lower year on year. This indicates that underlying market activity has not yet fully returned to 2025 levels.
‘Supply conditions strengthened further,’ explained Madas. ‘The AMVI was up by 2.9% month on month. Compared to April last year, stock availability was 28.6% higher, confirming a pronounced rebuild in supply and continued market normalisation.’
Market liquidity improved again in April. The average number of days needed to sell a used car fell to 62.7 days. This was an improvement of 1.2 days month on month and 0.9 days year on year. This suggests that turnover conditions are gradually strengthening despite softer year‑on‑year demand.
Looking at powertrain performance, BEVs were again the fastest-selling technology, taking 58.4 days to leave forecourts. Then came PHEVs at 58.9 days. Diesel cars followed at 61 days, while petrol-powered cars took 66.1 days to sell. HEVs sold the slowest, at 67.3 days.
Supply expected to normalise
RVs remained under pressure. After 36 months and 60,000km, %RVs fell to 46.3%. This was down 0.2pp month on month and 1.3pp year on year. Absolute trade RVs also decreased to €21,319, down 0.9% month on month, but still 0.4% higher year on year.
Meanwhile, list prices softened slightly, averaging €46,093 in April. This represented a 0.5% month‑on‑month decline. However, prices remained 3.3% higher than a year earlier, continuing to support absolute used‑car values despite falling retention rates.
Looking ahead, gradual downward pressure on %RVs is still expected as supply normalises further. By the end of 2026, %RVs are projected to decline by 1.6% compared with December 2025.
Pressure is predicted to ease somewhat in 2027, with a smaller decline of 0.9% expected. This indicates ongoing RV strain, driven by recovering supply, normalising demand, and elevated list prices.
Italy sees seasonal pattern
‘Used car RVs fell in Italy during April. %RVs reached 44.6%, down 0.4pp compared with March. This reflected a seasonal pattern that was broadly in line with expectations,’ highlighted Marco Pasquetti, cluster head of forecasting for Spain and Italy.
Compared with April 2025, %RVs were down by 3.8pp. This was stable on March’s Monthly Market Update, where values also dropped by 3.8pp year on year to 45%.
Average days‑to‑sell for used cars reached 55.4 days, improving by 3.4 days compared with March. However, turnover remained marginally slower than a year ago, with an increase of 1.1 days. Apart from the Dacia Sandero, four of the five fastest‑selling models came from Toyota. Each averaged around 30 days on market.
An analysis of listings across online marketplaces points to a phase of relative stabilisation. The SVI did continue to edge lower. However, the 1.5% month-on-month contraction remains limited and does not indicate a material deterioration in underlying demand.
Encouraging signals emerged from electric powertrains. For the first time since values began declining in 2024, the pace of depreciation slowed for PHEVs and BEVs.
%RVs of all-electric cars slid by 0.1pp compared with March, while PHEVs fell by just 0.2pp. This compares with a market average drop of 0.4pp. In contrast, LPG was the weakest performer, recording the sharpest decline at 0.6pp.
Spain sees EV interest
Spain’s new-car market continues to grow at a steady pace despite the ongoing global situation. Specifically, sales in March rose by 11.7% compared with March 2025, and year-to-date growth stands at 7.6%.
Electric vehicles (EVs), covering BEVs and PHEVs, powered this growth. The powertrain grouping saw registrations increase 62.2% year on year. This meant EVs accounted for roughly a fifth of the new-car market in the first quarter.
More competitive pricing and the incentives offered by the country’s Auto+ Scheme have helped spur this increasing interest in EVs. Rising fuel prices and improvements to infrastructure have also helped to shrink the barriers to demand.
This growing interest in electrification is also evident in the used-car market. Transactions of used PHEVs grew by 51.3% while BEVs saw an increase of 48.8% in the first quarter. However, EVs still only accounted for 4.2% of Spain’s used-car market in the period.
More affordable models
‘This demand is not clearly reflected in the average EV transaction price,’ explained Ana Azofra, regional head of valuations and insights. ‘The mix of used cars on offer now features a greater proportion of entry-level models. There are also more models from Chinese brands with highly competitive pricing strategies.’
PHEVs remained virtually unchanged at €28,329 for a three-year-old car at 60,000km. Meanwhile, BEVs experienced a slight drop compared with March, down to €24,379.
Petrol cars saw their RVs rise by 0.8% compared with the previous month, while diesel car values fell by 0.2%. In contrast, HEVs showed no signs of slowing down and led the way once again with a 1.2% increase in their average transaction value. Unsurprisingly, the powertrain also occupied several places in the fastest-selling models ranking.
The Dacia Sandero took first with an average turnover of 42.4 days, compared with the market average of 74.3. The Sandero was followed by the Toyota Yaris Cross and the Cupra Formentor.
Positive market trend in Switzerland
Following a recovery in February and March, used‑car demand in Switzerland continued to improve in April. The SVI rose by 3.3% month on month. Demand was 2.1% higher compared to April 2025, confirming a gradual but sustained recovery following weakness in January.
Supply conditions eased slightly. The AMVI declined by 1% compared with March. However, the index was up 4% year on year. This indicates that stock availability exceeded last year’s level despite the recent monthly dip.
%RVs continued to decline in April. The average %RV for a 36-month-old car at 60,000km dropped to 41.3%. This marked a month-on-month decline of 0.2pp and a sharper year-on-year drop of 2.4pp. This highlights persistent depreciation pressure in the Swiss used‑car market amid elevated supply and rising prices.
HEVs retained the most value of any powertrain in April at 46.2%. Then came petrol-powered cars at 42.6%, diesel-powered models at 40.9% and PHEVs at 39.2%. BEVs continued to be the worst-performing powertrain, holding only 35.6% of their original list price.
Absolute trade RVs decreased slightly to CHF 26,543 (€28,940), down 0.6% month on month, but remained 2% higher year on year. List prices edged lower, averaging CHF 64,192, a 0.2% month‑on‑month decline, while remaining 7.8% higher than a year earlier.
Used-car market speeds up
‘Market liquidity improved noticeably in April,’ revealed Madas. ‘The average time needed to sell a used car dropped to 73.3 days, representing a 3.1‑day improvement month on month and a 1.2-day improvement year on year.’
HEVs sold fastest at 56.7 days, followed by BEVs at 68.3 days and by petrol cars at 71.4 days. This was followed by diesel cars at 79 days. PHEVs took the longest to leave forecourts at 88 days.
Looking ahead, %RVs are forecast to decrease further in the coming years, but at a slower pace. By the end of 2026, %RVs are expected to fall by 1.5% compared to December 2025. A further 0.5% drop is anticipated in 2027.
Demand improves in UK
The April 2026 Monthly Market Dashboard showed that demand improved in the UK’s used-car market. This was even as %RVs softened across most fuel types.
Month on month, the average %RV of a three-year-old car at 60,000km slipped by one percentage point to 47.4%. However, compared to 12 months earlier, it was 3.4pp lower.
Value retention performance weakened across most fuel types in April. BEV %RVs fell to 34.6%, down 1.7pp compared to March. PHEV values declined by 1pp to 44.5%. Petrol values eased by 1.2pp to 48.7%, and HEVs also dropped 1.2pp to 51.7%. Diesel values strengthened, rising 1pp to 58.3%.
Market-wide retail activity strengthened with the SVI indicating that transactions increased by 6.3% compared to March. The AMVI confirmed a 10.6% month-on-month increase in the volume of cars advertised on dealer forecourts.
The UK’s new-car market often sees delivery spikes in March and September, as new registration plates are released. This can affect supply into the used-car market as buyers wait for their new-plated vehicles.
‘This increased level of stock likely resulted from March’s plate-change,’ commented Jayson Whittington, regional head of valuations for the UK. ‘Nevertheless, the time it took dealers to sell a used car improved, dropping to 32.8 days on average. This marked a reduction of 5.6 days compared to March.’
Average days to sell varied notably by fuel type. Petrol and HEVs were the fastest movers, taking 31.4 and 31.7 days respectively, reflecting strong consumer demand. BEVs followed at 34.8 days, indicating steady turnover. PHEVs took longer to sell at 38 days, although they still experienced a 2.4-day improvement compared to March. Diesel vehicles took the longest amount of time to sell, averaging 40.3 days.
Price differences between European used-car markets are creating cross-border sales opportunities for dealers, especially for electric vehicles (EVs). However, after identifying these opportunities, utilising them efficiently and at scale can present a challenge. Tom Hooker, Autovista24 journalist, explores the topic at this year’s Used Vehicle Retail Summit.
Different European used-car markets can see varied metrics in terms of pricing, stock days and residual values (RVs). This regional difference also applies to EV demand, which is seeing variable adoption rates across the continent.
For example, the average trade RV of 36-month-old battery-electric vehicles (BEVs) at 60,000km diverged between neighbouring countries in March. According to Autovista24’s Monthly Market Update, this value sat at €16,371 in France, while in Spain, BEV RVs stood at €24,553.
The average number of days needed to sell a two-to-four-year-old BEV also experienced contrasting results across Europe in the month. The turnover rate was 84.2 days in France, compared to an average of 58.8 days in Germany.
In this context, cross-border remarketing can unlock potentially untapped value. It allows sellers to capitalise on locations where EV demand is greater, prices are higher, and stock days are lower. It also presents an opportunity to move models away from a market experiencing stagnating demand or oversupply.
Cross-border opportunities
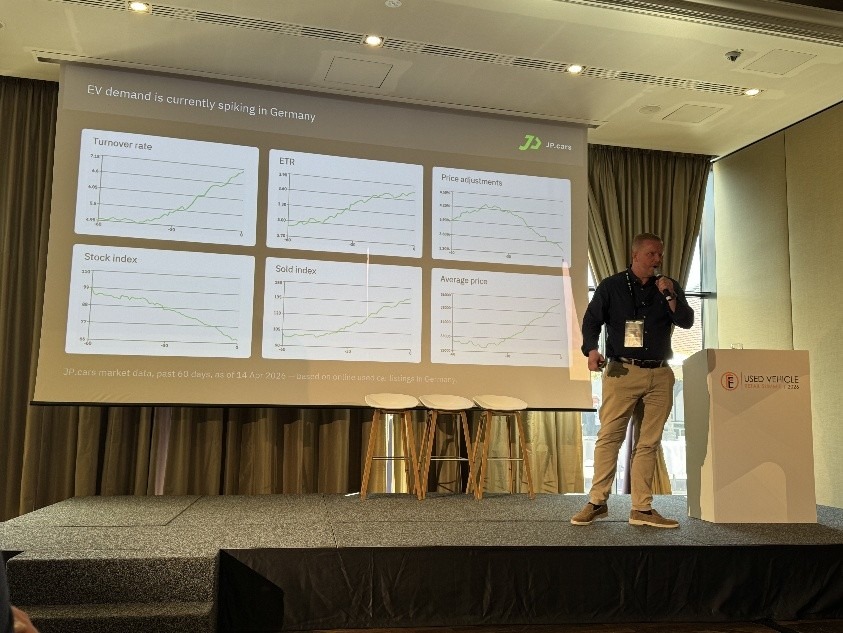
‘Supply and demand levels in every single market are continuously evolving and changing. It is simply impossible to manually monitor supply and demand for each market continuously. You need technology,’ outlined Jan-Willem Seeder, founder and CEO of JP.Cars, in his presentation.
‘If you are not using technology, you are always reacting to the market. The concept of supply, demand and marketability is not so complex. The complexity is seeing and monitoring it in real time,’ he noted. Continuously evolving supply and demand can cause different outcomes in each country, even for the same model.
Seeder stated that in Germany, all the signals clearly show that [EV] demand significantly outpaced supply. Turnover rates increased, stock indexes dropped, selling indexes rose significantly, and prices went up as well,’ stated Seeder.
Jan Willem Seeder, founder and CEO of JP.Cars.
‘If you must buy a BEV in Germany, given these signals, I can imagine it is a very tight market today,’ he said. ‘The question might be, where can I source these cars? Maybe there are markets with other supply and demand ratios across Europe where you could potentially buy similar cars.’
He recognised that there are markets in Europe where supply and demand ratios are different from those in Germany. There could be buying opportunities in numerous markets where buyers could source vehicles.
‘If you have purchased cars for 100 years from a single source in Germany, and that source is providing you with EVs, you will have a very hard time. The market is not local anymore; the market is international,’ he commented.
Optimising cross-border adverts
Rolf Westgeest, founder of Eurostocks, focused on how cross-border transactions operate on classified marketplace portals. These online platforms allow buyers to search listings and contact sellers directly, rather than purchasing through the platform.
‘There are two things in cross-border trade you can do as a car dealer or retailer. You can go on the auction side with lower prices and fast sales. Or you can go to the classified marketplace portals. It is a higher price, but it could be slower sales of 30 days, 90 days or one year.’
So, if dealers want to benefit from these higher prices, they will need to navigate potentially slower sales. Westgeest highlighted multiple areas where dealers can improve.
From left to right: Rolf Westgeest, founder of Eurostocks. Michel van Roon, founder and co-owner of Novatrade24.
Westgeest explained that having adverts appear at the top of search queries can help tackle delays. Photo quality and selection can make a big difference in achieving a high search ranking. The number of reviews under a dealer’s profile is also important. Using analytics provided by the portals can help optimise every advert, too. Despite all this, lead response times can often be the deciding factor.
‘After one hour, 50% of the leads are lost because they are already in a conversation with somebody else. In these portals, people send multiple emails to different dealerships selling the same cars. The first one to respond can make the appointment and win the sale,’ Westgeest told the audience.
Overall, Westgeest highlighted that cross-border sales do not need to be difficult, especially when using marketplace portals. Dealers will see the best results if they choose the right cars, tools, and strategies for online advertising.
Cross-border risks
Alongside benefits, cross-border used-vehicle sales can also come with some legal risks. This can include unintentional participation in value-added tax (VAT) fraud schemes or money laundering ploys. Michel van Roon, founder and co-owner of Novatrade24, explained that this possibility has caused dealerships to hold back.
‘By not participating [in cross-border sales] dealerships leave money on the table, because they are afraid of getting trapped into these schemes. If you want to step into that game, you need to know the rules. You must keep in mind that the tax authorities will have one question. Did you know or could you have known that your buyer was a criminal?’ outlined van Roon.
From left to right: Michel van Roon, founder and co-owner of Novatrade24. Rolf Westgeest, founder of Eurostocks.
Van Roon then outlined the evidence dealers must provide to apply the 0% VAT rate when exporting vehicles. The information and research required is extensive. He also noted that the person responsible for this in a dealership is usually a salesperson.
‘If you look at how much time you take in getting leads, a salesperson should not chase documents. They should chase leads. That is their job. So, if you look at this cross-border trade process, it is full of friction,’ he commented.
Is cooperation the key?
Van Roon suggested that dealerships in the automotive industry cooperate on this issue. To solve it, digital platforms can be used to simplify cross-border vehicle trading.
These platforms manage the legal, administrative, and transaction processes between buyers and sellers in different countries. This can make dealers more confident when participating in cross-border sales. It can also increase trust between dealers, tax authorities and banks.
‘Cross-border compliance does not need to hold you back from doing the trades you need to do to get the best results. But beware of the consequences and requirements,’ warned van Roon.
Together, these sessions highlighted a clear opportunity in the European used-car market. Price fragmentation, especially among EVs, is creating significant opportunity for sellers. However, only those with the right tools and processes to act across borders stand to benefit.
How will new-car markets transform over the course of 2026? Plus, what is happening with used-car supply and demand in Europe? Autovista24 editor Tom Geggus finds out in the latest Automotive Update podcast.
In this episode, Autovista24 reviews the latest JD Power webinar, which explored Europe’s new-car outlook. Plus, a look into the latest residual value (RV) trends in the continent’s used-car market.
The session covered Europe’s new-car market outlook from 2026 to 2040 across multiple powertrains. Panellists also delved into the bloc’s diverging electric vehicle (EV) adoption and the factors behind it. Plus, the webinar reviewed upcoming technologies and emerging brands expanding across the continent.
Attendees were asked how much they thought Europe’s new-car market would grow, or shrink, by the end of this year. 40% of respondents expected a year-on-year improvement between 0% and 2% compared to 2025.
This matched the latest EV Volumes forecast, which projected a 0.2% increase in its March update. However, this was reduced from the 1.5% growth forecast in its December report.
The March update also projected overall growth for European light-vehicle sales, which includes new cars and light-commercial vehicles. In 2026, a year-on-year increase of 0.1% is forecast, down from 1.7% in the previous report.
The panel also discussed varying EV adoption rates in the bloc. They identified key structural differences that are either limiting or assisting plug-in uptake.
Furthermore, the experts showed how, in some instances, EVs are closing the price gap to internal-combustion engine models. This comes as the choice of small EVs on the new-car market continues to widen.
In Austria, France, Germany, Italy, Spain, Switzerland and the UK, values are expected to decline by the end of 2026. However, these drops are expected to be slight.
A drop is also projected across all observed markets in 2027. This is the case in 2028 as well, except for Italy, with marginal growth forecasted.
RVs became inflated during the COVID-19 pandemic when supply was low, but demand was high. As these drivers balanced out, values underwent a period of normalisation.
In March 2026, the active-market volume index (AMVI) for 24-to-48-month-old used cars showed year-on-year growth in every observed market. When compared to February 2026, only the UK suffered a marginal downturn, with a slight 1.1% dip in supply.
The sales-volume index (SVI) of 24-to-48-month-old cars also increased compared with March 2025. This trend occurred in six of the seven observed markets, except for Italy, which recorded a 1.1% decline. Month-on-month results were more mixed, as single-digit drops were recorded in France, Italy and the UK.
If supply continues to outpace demand, RVs will face increased pressure, with more units available and fewer potential buyers.
Are levels of supply and demand balanced across major European used-car markets? Alongside regional experts, Autovista24 editor Tom Geggus explores the data from March in the latest Monthly Market Update.
There were positive developments in both supply and demand across many major European used-car markets during March. Key performance indicators, including the sales-volume index (SVI) and the active-market volume index (AMVI) in many countries, reveal an emerging balance.
Cars 24 to 48 months old saw dealership sales increase compared to February in four of the seven observed markets. While changes in France and Italy were marginally negative, the UK saw a double-digit decline. However, the country also saw one of the biggest stock day improvements, with cars taking less time to sell.
Changes in the SVI were more uniform across markets when compared with March 2025. Only Italy saw the indicator drop, with a small 1.1% fall. Meanwhile, Germany, the UK and Spain all recorded double-digit increases.
Five of the seven observed markets saw year-on-year AMVI growth, exceeding the SVI performance as more used-car adverts appeared. This reveals a normalisation in supply, which was mirrored in the month-on-month results. Only the UK saw a downturn within this comparison.
So, many major used-car markets are seeing greater balance in the supply and demand of used cars. However, if supply outpaces demand, residual values (RVs) will feel greater pressure as stock levels exceed the number of buyers.
Austria sees stronger turnover
Austria’s SVI for two‑to‑four‑year‑old passenger cars continued to improve in March. After a strong rebound in February, the metric increased by 7.1% month on month. Compared with March 2025, the SVI was 3.2% higher, marking an improvement from the year‑on‑year decline reported in February.
The AMVI also edged slightly higher. It recorded a 1.7% month‑on‑month increase and a 3.7% year-on-year rise. This confirmed that stock was above last year’s levels.
‘Turnover strengthened noticeably in March,’ highlighted Robert Madas, regional head of valuations. ‘The average time needed to sell a car dropped to 69.7 days, a significant seven‑day month-on-month improvement. Compared to March 2025, days to sell were broadly stable.’
Diesel models took the lead in turnover speed again, with an average of 65.2 days to sell. This was followed by petrol cars taking an average of 70.6 days to sell. Then came plug-in hybrids (PHEVs) at 73.5 days, followed by battery-electric vehicles (BEVs) at 75.7 days. This was a significant improvement of 13.1 days from last month. Full hybrids (HEVs) took the longest time to sell at 79.4 days.
Pricing dynamics showed slightly increasing developments. The average trade RV of 36‑month‑old cars at 60,000km increased to €23,070, up 2.1% month on month and 7.8% year on year.
Structural depreciation pressures
RVs as a percentage of retained list price (%RV) improved to 47.3%, up 0.2 percentage points (pp) compared to February. Year on year, %RVs decreased by 0.7pp, pointing to ongoing structural depreciation pressure amid rising supply and normalising demand. List prices remained at elevated levels, climbing to an average of €48,765, an increase of 1.8% month on month and 9.3% higher year on year.
HEVs retained the highest trade value at 50.5%, followed by petrol cars at 49.4%. Then came diesel models with 48.2% and PHEVs with 45.4%. BEVs held the lowest %RV once again, at 37.7%.
‘The RV outlook remained broadly unchanged. %RVs are forecast to decline gradually over the coming years as supply normalises further,’ Madas said.
In December 2026, a 0.5% year-on-year decline is forecast. This decline is expected to accelerate to 0.7% in 2027, indicating a slow but steady downward trajectory in retained values. This is consistent with a market that is more balanced and less supply-constrained than in recent years.
France sees RV bounce
‘RVs fell slightly in France during March, compensating for the slight increases recorded in previous months,’ explained Ludovic Percier, senior RV analyst for France. ‘This brought the overall RV trend back to levels seen in November 2025.’
Petrol-powered car values decreased marginally but were stable compared with November 2025. Overall, the fuel type has seen a level RV performance, while other powertrains experienced larger decreases. Additionally, petrol is still offered by many manufacturers while diesel models are getting rarer.
Diesel recorded a slight RV fall in March but still did better than at the end of 2025. The fuel type continues to see demand in the used-car market. Fleets are also not buying as many new diesel-powered cars as they have previously.
HEVs saw a small value drop last month. The powertrain has been gaining popularity among manufacturers as they offer more models with the technology. This means more HEVs on the used-car market, with most of these new entrants being from established brands.
Toyota continues to lead the way on the used HEV market. In recent months, three Toyota models have appeared in the top five fastest-selling ranking for the powertrain. Overall, used HEVs are still in demand in France, but carmakers cannot risk adding big price premiums to these models. This would jeopardise their value retention.
PHEV supply and demand imbalance
The supply and demand for PHEVs remains imbalanced. In previous years, many vehicles were sold to fleets on the back of fiscal advantages, with a high list price on the new-car market. This strategy explains such low RVs. Vehicles offering an electric-only range of below 60km have been most affected.
PHEVs were once again among the slower-selling used cars in France. There was a decline in average days to sell in March as more of these models came back from leasing. Compared with newer PHEVs, the electric range of these older units is not as substantial. Larger electric ranges have supported the value retention of more recent plug-in hybrids.
BEV values were stable after months of declines. Three years ago, models were being launched with greater ranges. The impact of this can now be seen on the used-car market, with these cars retaining slightly more value.
BEVs from lower segments with smaller list prices and lower ranges have been impacted more by the environmental bonus and the social leasing scheme. Upper segments have not yet been affected by the fiscal advantages for fleets. Those vehicles will come to the used-car market in early 2028.
‘BEVs continued to struggle, spending 84 days on average in stock, compared with the overall market average of 66. The powertrain also retained 35.6% of its new car list price after 36 months and 60,000km in March. This was compared to the overall market’s 50.7%,’ Percier outlined.
Increased used-car demand in Germany
Used‑car demand in Germany increased again in March following a strong rebound in February. The SVI rose by 28.8% month on month. Demand remained well above last year’s level, with the SVI 32.4% higher year on year, indicating a stronger market than in early 2025.
‘Supply conditions also continued to stabilise,’ said Madas. ‘The AMVI was up slightly by 0.9% month on month and 21.2% higher year on year. This confirms a further expansion of available stock and ongoing normalisation of used‑car supply.’
The average number of days needed to sell a used car hit 65.5 days, a 2.8‑day improvement month on month. However, this was 3.9 days longer than a year ago, signalling that despite improved turnover, the market remains slower.
Looking at powertrain performance, BEVs were the fastest-selling technology, taking 58.8 days to leave forecourts. Then came PHEVs at 62.4 days. Diesel cars followed at 64.5 days, while HEVs took 66.4 days. Petrol-powered cars sold the slowest, at 68.6 days.
RVs still under pressure
RVs remained under pressure in the country, as %RVs fell to 46.5%. This was down 0.3pp month on month and 1.1pp year on year. Absolute trade RVs also decreased to €21,532, a 1.4% decline month on month, though still 1.1% higher year on year.
‘Meanwhile, list prices dipped to €46,345, down 0.6% from February, but remained 3.6% higher compared to a year ago. This continued a long‑term upward trend in new‑car pricing,’ Madas commented.
By fuel type, petrol-powered cars continued to lead with a %RV of 48%, followed closely by diesel at 47.8% and HEVs at 47.2%. PHEVs held on to 43.1% of their value, while BEVs remained the lowest at 37.1%, maintaining the powertrain gap observed throughout 2025.
Looking ahead, gradual downward pressure on %RVs is still expected as supply normalises further. By the end of 2026, %RVs are projected to decline by 1.6% compared with December 2025. Pressure is predicted to ease somewhat in 2027, with a smaller decline of 0.9% expected. This indicates ongoing RV strain, driven by recovering supply, normalising demand, and elevated list prices.
Weaker Italian market?
‘The Italian used-car market continued to show signs of weakness in March. This confirmed a negative trend which has been persistent for several months,’ explained Marco Pasquetti, cluster head of forecasting for Spain and Italy.
The SVI indicates overall demand stability. Levels were slightly lower than both February 2026 and March 2025, but the drops cannot be considered particularly significant.
As for sales pace, the average days to sell stood at 59.1 days. This marks an increase of 1.7 days compared to the previous month, yet still 6.4 days fewer than in March 2025.
Based on the latest figures, the outlook for the end of 2026 remains negative. Compared with 12 months ago %RVs were down. Levels fell from 48.8% in March 2025 to 45% a year later.
PHEVs saw the most pronounced %RV drop, down 5.2pp to 39.1%. BEVs also saw value retention fall, down 2.7pp to 28.3%, confirming a general cooling in demand for electric powertrains.
Spain regains momentum
‘After a more subdued January, the Spanish new-car market appears to have regained the momentum it ended 2025 with,’ said Ana Azofra, regional head of valuations and insights. ‘In February, 97,082 units were registered, representing a 7.5% year-on-year increase, confirming the market’s positive trend.’
Electric vehicles (EVs) continued to be the main driver of sales, with registrations increasing by 21.6% year on year. This meant BEVs and PHEVs took a 21.6% market share in February.
This momentum is expected to increase once the regulatory framework of the new Auto+ Plan is announced. It will not only incentivise the purchase of BEVs and PHEVs but also the installation of home charging points. In addition, rising fuel prices are likely to further increase interest in EVs.
Stable used-car market
‘Used‑car sales have not followed the same trend in the first few months of the year. The market currently appears more stable,’ said Azofra. ‘Transaction prices have remained broadly stable, having changed by approximately €10 since February’s report.’
Specifically, the average price of a typical three-year-old used car at 60,000km, traded between professionals, is just under €20,342. This resilience means prices remain 2.4% above the level recorded in March 2025. As recorded by the AMVI, a 6.8% increase in supply is helping support price stability.
However, performance varied by powertrain. Petrol, diesel and HEV models have seen positive value retention, while BEVs and PHEVs recorded marginally negative adjustments. Month on month, the absolute RVs of PHEVs dipped by 0.6%, while BEVs experienced a larger fall of 2.4%. However, both powertrains saw levels remain well above those recorded in March 2025.
Despite these minor adjustments, significant declines are not expected. This follows the improvement of a key-performance indicator in March: the number of days needed to sell a used car. The current average time stands at 78.8 days, ranging from 86.2 days for BEVs to just 69 days for full hybrids.
As a result, the ranking of the fastest‑selling models in March was led by the Toyota RAV4. Leading the HEV category, it took only 13.2 days to sell. It was followed by the Hyundai Ioniq and Hyundai Kona, with 41.2 and 42.8 days, respectively.
Switzerland sees demand improvement
Used‑car demand in Switzerland continued to improve in March following a recovery in February. The SVI rose by 1.3% month on month. Compared with March 2025, this key-performance indicator for demand was 2.4% higher. This confirmed a growing trend after the disruption seen at the start of the year.
Supply conditions also improved slightly. The AMVI was up 0.8% month on month and 3% year on year. This indicates that stock remains above last year’s levels, supporting broader market stability.
Madas confirmed that: ‘%RVs continued to decline in March. The average %RV for a 36‑month‑old car at 60,000km dropped to 41.5%, representing a 0.2pp decline month on month and a 2.6pp decline year on year. There is persistent depreciation pressure in Switzerland, driven by rising list prices and more balanced supply and demand.’
HEVs retained the most value of any powertrain in March by far at 46.7%. Then came petrol-powered cars at 42.9%, diesel-powered models at 41.3% and PHEVs at 39.4%. BEVs continued to be the worst-performing powertrain, holding only 35.5% of their original list price.
Slower value descent forecast
Absolute trade RVs increased slightly to CHF 26,716 (€29,036). This was up 0.9% compared with February, and 2.4% higher than a year ago. Rising list prices continue to support absolute used‑car values despite the downward movement in %RVs. List prices climbed to CHF 64,368, a 1.3% month‑on‑month increase and a strong 9% rise year on year.
The average time needed to sell a used car stood at 77.8 days. This was a marginal improvement of 0.1 days month on month and a stronger 0.5‑day improvement year on year. This indicates that turnover is holding up reasonably well despite ongoing value pressure.
BEVs sold fastest at 73.4 days, followed by petrol cars at 76.4 days and by HEVs at 78.2 days. This was followed by diesel cars at 79.7 days. PHEVs took the longest to leave forecourts at 88.8 days.
‘Looking ahead, %RVs are forecast to decrease further in the coming years, but at a slower pace,’ Madas outlined. ‘By the end of 2026, %RVs are expected to fall by 1.5% compared to December 2025. A further 0.5% drop is anticipated in 2027.’
UK feels plate-change effect
‘RVs in the UK continued to trend downwards in March, albeit marginally,’ said Jayson Whittington, regional head of valuations for the UK. ‘RVs presented as a percentage of retained list price after 36 months and 60,000km declined by 0.7pp compared with February.’
Petrol and PHEV values saw the biggest declines in the country, down by 0.6pp and 0.7pp, respectively. Meanwhile, BEVs bucked the downward trend with a 1.1pp rise. However, it is important to remember that the month’s plate-change effect can mask true market performance.
In March, a car registered three years ago will display a 23 plate, yet in February, a three-year-old car would show a 72 plate. This plate distinction commands a higher value in the region of 3pp. So, without the plate-change effect, there would have been a greater decline compared to February. A direct comparison with March 2025 shows market-wide %RVs fell by 2.8pp.
Across all powertrains, vehicles averaged 39.5 days to sell, improving by 6.5 days month on month. BEVs once again recorded the fastest turnaround at 33.9 days.
Sales activity softened. The SVI dropped by 11.3% compared to February. Most fuel types experienced a significant reduction, except for BEVs, which recorded a 3.6% increase.
The overall AMVI showed a marginal advert reduction of 1.1%, which indicates reasonable supply stability. The volume of BEVs increased this month by 13.6%, as dealers took advantage of the increasing popularity of the powertrain. Overall, March brought improved stock turnover but weaker RV performance in the UK. It will be interesting to monitor vehicle supply in the coming weeks. Part exchanges and lease de-fleets generated by March’s plate change will begin hitting retail forecourts.
The second generation of the Volkswagen (VW) T-Roc has been long-awaited. But do improvements to the SUV make it more appealing? Autovista24 special content editor Phil Curry reviews the model alongside regional experts.
The VW T-Roc sits between the Tiguan and the T-Cross in the carmaker’s SUV lineup. Now the second generation aims to maintain the momentum of the first.
To do this, the manufacturer appears to have listened to drivers. VW has updated what already worked and changed what did not in the first generation. In doing this, they have created a new model that is expected to appeal instantly.
Autovista24’s latest Launch Report benchmarks the VW T-Roc against its key competitors in Austria, France, Germany, Spain and the UK. Regional experts also provide a breakdown of the car’s strengths, weaknesses, opportunities and threats.
Evolution of the T-Roc
VW has adopted an evolutionary design philosophy for the new T-Roc. However, it is bold enough to work. Sometimes transitional styling options can make a new model feel old or unappealing. Yet the carmaker has created something which stands out, making it attractive to new and old buyers.
The new T-Roc links into VW’s current design language. It features a lower grill and a sweeping LED light bar across the front end, between the narrow headlights. There is also an illuminated badge to show the branding even at night. This does make it look reminiscent of the ID. range, but with no battery-electric option, this could prove polarising.
Source: VW Press UKSource: VW Press UKSource: VW Press UK
The rear also features a full-length light bar and an illuminated badge. With a sweeping diffuser, its angular look provides a dynamic profile. The R-Line model leans into its sporty design credentials, with bigger wheels and a bigger grill. It also gets a floating roof, to add to the dynamism.
But the new design also provides the new VW T-Roc with larger dimensions than its predecessor. On the outside, this makes it look bigger and safer, giving it a larger stance. Inside, this means more room for occupants.
A quality interior
While the exterior styling is evolutionary, VW has taken the interior to another level. Inside, the previous generation was rather safe and unassuming. In the new generation, a lot of thought has gone into providing a comfortable, high-quality feel.
Yet it is also not a bold design. A large centre console runs down the middle, separating the driver and passenger while giving a sense of comfortable confinement. The steering wheel is practical, with numerous physical buttons for various vehicle systems. VW has moved away from the ‘slider’ buttons, which proved divisive on other models.
Source: VW Press UKSource: VW Press UKSource: VW Press UK
A display behind the steering wheel provides plenty of driver information, while the 12.9-inch infotainment screen is responsive and clear. The lowest-trim model has a 10.3-inch screen, but it is still a decent size.
The dashboard is large, but the materials used provide a sense of quality. This does not feel like a cheap car. Instead, it feels more premium moving through VW’s SUV range to the top-level Tiguan.
Rear-seat passengers also get plenty of legroom, and headroom is good too. There are plenty of storage areas, while the 475-litre boot provides ample space.
T-Roc on the road
The new T-Roc comes with a complement of 1.5-litre petrol mild-hybrid powertrains, in either 110hp or 150hp offerings. Further engine specs are planned for a future launch, as well as hybrid options. However, there is no pure battery-electric variant currently available.
The carmaker has developed the T-Roc well. It provides a smooth driving experience, with precise steering and effective brakes. However, the ride can get a little bumpy on more imperfect roads. This is particularly pronounced in models with the larger specification alloy wheels.
Source: VW Press UK
Acceleration is effortless and is aided by a dual-clutch system, allowing the seven-speed automatic gearbox to change seamlessly. It all adds up to make driving the T-Roc easy, despite its size.
Overall, VW has re-engineered the T-Roc into a car that drivers want. It provides a quality feel and a better design than its predecessor. However, it has not strayed too far from the popular first model.
In a continually growing automotive segment, with many new players appearing, the T-Roc achieves something different. It does not stand out because it is new, but because it is familiar.
View the interactive dashboard, which benchmarks the VW T-Roc in Austria, France, Germany, Spain and the UK. The interactive dashboard presents new prices, forecast RVs, and SWOT (strengths, weaknesses, opportunities, and threats) analysis.
Residual values (RVs), presented as a percentage of retained new-car list price (%RV), kept sliding in Europe during February. But is this descent slowing, and what comes next? Autovista24 editor Tom Geggus unpacks the data with regional experts.
The average retained value of a 36-month-old car at 60,000km dipped again across many European used-car markets. In February, Austria, Germany and Switzerland saw new lows compared with the last 12 months.
Meanwhile, France and Spain saw lower value retention rates in January. At the start of 2026, Italy and the UK saw %RVs above rates recorded in December and August 2025, respectively.
Both France and Spain saw a marginal month-on-month %RV improvement. Meanwhile, Austria, Germany, Italy, Switzerland and the UK recorded declines compared with January 2026.
The downward trend is much more visible when comparing February 2026 with February 2025. All markets saw %RVs decline, with Italy performing the worst. Values dropped to 45.5%, down by 4.1 percentage points (pp) in the country.
While this appears drastic, trade values are still undergoing a process of normalisation following inflation during the COVID-19 pandemic. Compared with 2021, all markets continue to see higher levels of value retention.
Switzerland was the closest to its position five years ago, with values only 1.1pp higher. Three-year-old used cars in Germany continue to see higher levels, 4.5pp above where they were in 2021.
%RVs are expected to keep falling across these markets in the next three years. Italy is the only exception, which is forecast to see a marginal increase by the end of 2028. By the same point, France and the UK are expected to see the largest %RV declines of the seven markets.
Austria’s subdued market
Austria’s sales‑volume index (SVI) for two‑to‑four‑year‑old passenger cars recovered significantly in February. After a traditionally weak January, the SVI increased by 52.9% month on month. However, the SVI remained down compared to February 2025, with the index dropping 7.6% year on year.
The active‑market volume index (AMVI) also witnessed a slight bounce back. It rose by 1.4% month on month, while stock levels were 4% higher year on year. This indicates a well‑supplied market and a modest build‑up compared to 2025.
‘Turnover slowed again in February,’ stated Robert Madas, regional head of valuations. ‘The average time needed to sell a used car increased to 76.7 days. This marks a three‑day deterioration compared with January and a year-on-year increase of 1.5 days. This underlined subdued retail activity, despite improved sales volumes.’
Diesel models took the lead in turnover speed, taking an average of 71.5 days to sell. This was followed by petrol cars taking an average of 74.4 days to sell. Then came full hybrids (HEVs) at 78.3 and plug-in hybrids (PHEVs) at 87.9 days. Battery-electric vehicles (BEVs) continued to take the longest time to sell at 88.7 days.
RVs soften in February
Looking at pricing, the average RV of a 36‑month‑old car at 60,000km softened in February. The average trade RV reached €22,623, down 0.6% month on month.
%RVs in Austria declined to 47.1%, down 0.7 percentage points (pp) compared to January. Year on year, %RVs decreased by 1.4pp, reflecting continued downward pressure on used‑car values amid rising supply and normalising demand. List prices remained high, averaging €47,987 in February, a slight 0.8% increase month on month.
HEVs retained the highest trade value at 50.2%, followed by petrol cars at 49.3%. Then came diesel models with 48% and PHEVs with 43.9%. BEVs held the lowest %RV once again, at 38.8%. However, this was a slight improvement of 0.2pp month on month.
‘Looking ahead, %RVs are expected to decline slightly in the next few years,’ said Madas. ‘In December 2026, a 0.6% year-on-year decline is forecast. A 0.7% decrease in 2027 is expected to follow.
‘This points to a slow but persistent downward %RV trend in the coming years. This is consistent with a rebalancing market environment and ongoing supply normalisation,’ he highlighted.
France sees stability
RVs continued to be stable in France during February. Some powertrains saw slight month-on-month increases, although this was mainly due to a value drop in January. However, February’s results were stable compared with December 2025.
Petrol saw %RVs after 36 months and 60,000km increase compared with January. Yet they fell compared with December. Recent %RV declines for petrol have been minor as the fuel type holds its value better than other powertrains.
‘Many manufacturers offer petrol variants while diesel has become rarer,’ commented Ludovic Percier, senior RV analyst for France. ‘However, diesel has seen less impact, even managing to record %RV increases compared with January.’
HEVs saw stability in February, but their %RVs were below December’s results. This continues a declining value retention trend seen in recent months. This can be attributed to the increasing number of HEVs offered in France, most of which are from mainstream brands.
These models do hold value as well as Toyota’s HEVs. Three of the top five fastest-selling HEVs came from the Japanese brand. Used HEVs are in demand, but carmakers cannot risk adding big price premiums at the expense of RVs.
Supporting EV RVs
Used BEVs and PHEVs took the longest time to sell in France. However, RVs can be supported by newer models with increased ranges. While %RVs increased month on month for both powertrains, they fell compared with December.
PHEV demand and supply remain imbalanced. In previous years, many of these vehicles were sold to fleets on the back of fiscal advantages. They came with excessive new-car market list prices, explaining the lower RVs. Models offering an electric-only range of below 60km have been the most affected.
Higher-priced BEVs with longer driving range have seen larger absolute RVs and more stable %RVs. Lower segments with lower list prices and smaller ranges have been impacted by the environmental bonus and social leasing scheme.
‘Meanwhile, upper segments have not yet been impacted by fiscal fleet advantages,’ Percier added. ‘Those vehicles will come to the used-car market in early 2028.’
BEVs spent 85.5 days in stock on average, compared with the market average of 67.2, which is also high. The Tesla Model 3 was still the quickest to sell, while the Model Y was the third-fastest-selling used BEV. They remain in demand as their new prices drop once again.
Demand rebounds in Germany
Used‑car demand in Germany rebounded significantly in February after the seasonal downturn seen at the start of the year. The SVI jumped to 143, representing a 43% month‑on‑month increase. Despite this strong recovery, the SVI was down 13.7% year-on-year, as demand remained below last year’s level.
Supply conditions also improved. The AMVI rose slightly by 1.1% from January. Year on year, stock availability was 22.6% higher, confirming a continued and substantial rebuild of used‑car supply.
‘The average number of days needed to sell a used car increased to 68.3 days. This was a noticeable deterioration of 3.3 days month on month and year on year,’ highlighted Madas.
Looking at powertrain performance, BEVs were the fastest-selling technology, taking 61.6 days to leave forecourts. Then came PHEVs at 62.4 days. HEVs followed at 63.2 days, while diesel-powered vehicles took 69.9 days to sell. Petrol-powered cars sold the slowest, at 70.9 days.
Renewed pressure on RVs
RVs came under renewed pressure in February. The average %RV of 36‑month‑old cars at 60,000km declined slightly to 46.8%. This was down 0.1pp month on month and 0.9pp year on year.
In contrast, absolute trade values increased slightly to €21,855, a 1% improvement from January. This was supported by the continued rise in list prices, which climbed to €46,664. This was up 1.1% compared to January and up 4.2% year on year.
By powertrain, petrol-powered cars continued to lead with a %RV of 48.3%, followed closely by diesel at 48.2% and HEVs at 47.5%. PHEVs held on to 44.1% of their value, while BEVs remained the lowest at 37.1%, maintaining the gap observed throughout 2025.
Looking ahead, RVs are expected to remain under pressure, in line with previous forecasts. By the end of 2026, %RVs are projected to decline by 1.4% compared with December 2025.
‘Pressure is predicted to ease somewhat in 2027, with a smaller decline of 0.9% expected. This indicates ongoing RV strain, driven by recovering supply, normalising demand, and elevated list prices,’ Madas outlined.
Values fall in Italy
‘As expected, RVs continued to decline in Italy during February, in line with the trend observed in 2025,’ said Marco Pasquetti, cluster head of forecasting for Spain and Italy.
%RVs after 36 months and 60,000km stood at 45.5%. This corresponds to a decrease of 0.7pp compared to January and a drop of 4.1pp year on year. There are no signs of this trend reversing, with the downward trajectory likely to persist throughout 2026. By December, %RVs can be expected to decline by 6.2% overall.
There were no surprises across the various powertrains. All of them saw proportionally consistent declines in line with the overall market trend. Diesel, although declining, remained the technology with the best retention of list price value at 50.1%.
In terms of volume, it also continues to be in high demand on the used‑car market. This is likely due to signals from some manufacturers that they are considering reinvesting in these engines, including Stellantis.
The average time required to sell a used vehicle on major online marketplaces improved compared to January 2026 and February 2025. In particular, the year-on-year improvement is notably positive for BEV and PHEV vehicles. If this trend continues, it could indicate a slowdown in the decline of RVs for these powertrains.
Bad start for Spain’s used-car market
New-car sales in Spain began 2026 with a slight increase of 1% compared to January 2025. Electric vehicles (EVs), including BEVs and PHEVs, showed strong momentum.
Sales of these powertrains increased by nearly 50% as they represented over a fifth of the new-car market. By channel, private buyers and companies recorded significant declines. Only rental companies saw their registrations increase, up by 63.5%.
These rent-a-car renewals have returned a significant volume of young used vehicles to the market. This made it the only channel to record positive results compared with January 2025.
‘Overall, the start of the year has not been good for used-car sales, which fell by 9%,’ noted Ana Azofra, head of valuations and insights for Spain.
‘BEVs and PHEVs continue to gain share, benefitting from growing demand for electrified alternatives,’ she added. ‘This increased interest is reflected in the evolution of average transaction prices, with increases across all electrified powertrains.’
Average absolute RVs of 36-month-old BEVs and PHEVs at 60,000km saw month-on-month increases of 5.3% and 8%, respectively. Only petrol vehicles suffered a slight month-on-month decrease in their average absolute RV, down 0.5%.
Although the overall situation is positive, used cars saw a longer turnover rate compared with January 2026 and February 2025. The only exception was BEVs, which sold 13.3 days faster than 12 months ago. Despite this, the powertrain still took the longest time to sell.
The model with the best rotation times in February was the Dacia Sandero, with an average rotation of 42.4 days. Then came the Volkswagen T-Roc with 51.2 days, and the Toyota Corolla with 53.5 days.
Switzerland sees weaker RVs
Used‑car demand in Switzerland made a good recovery in February. The SVI surged by 48.5% month on month. Despite this rebound, demand remained 2.1% lower year on year, indicating continued pressure compared to early 2025.
Supply conditions softened slightly. The AMVI fell by 2.3% month on month but remained 5% above last year’s level. This confirms that stock availability is still higher than in early 2025 despite the temporary dip.
‘%RVs weakened in February,’ Madas commented. ‘The average %RV of a 36‑month‑old car at 60,000km dropped to 41.7%, down 0.8pp month on month and 2.9pp year on year. This underlines the ongoing depreciation pressure in the Swiss used‑car market.’
In absolute terms, trade RVs decreased slightly to CHF 26,501 (€29,062), a 0.9% month‑on‑month decline. Yet, this was still 0.9% higher year on year.
List prices continued to rise, averaging CHF 63,610, representing a 1.2% increase month on month and an 8.1% rise year on year. This ongoing inflation in list prices helps support absolute used‑car values, even with falling %RVs.
HEVs still on a high
HEVs retained the most value of any powertrain in February by far at 46.7%. Then came petrol-powered cars at 43.2%, diesel-powered models at 41.5% and PHEVs at 39.7%. BEVs continued to be the worst-performing technology, holding only 35.5% of their original list price.
The average time to sell a used car increased marginally in February, rising to 77.9 days. This was 0.4 days slower month on month, but still a strong 4.3‑day improvement year on year. This reflects better turnover conditions than in early 2025.
HEVs sold fastest at 69.4 days, followed by BEVs at 75 days. This was followed by diesel cars at 77.2 days and petrol-powered models at 78.6 days. PHEVs which took 82 days to leave forecourts.
Looking ahead, %RVs are forecast to decrease further in the coming years, but at a slower pace. By the end of 2026, %RVs are expected to fall by 1.4% compared to December 2025. A further 0.5% drop is anticipated in 2027.
UK sees strong growth
‘The UK’s used-car market recorded strong growth in February 2026,’ commented Jayson Whittington, regional head of valuations for the UK. ‘Overall, there was a clear upswing in sales momentum, led by electrified powertrains. However, pricing pressures remained evident across most fuel types.’
All fuel types posted positive month-on-month SVI gains. On average, the metric was up by 25% across all powertrains, highlighting broad demand.
BEVs led the market with a 29.8% rise, closely followed by PHEVs at 29.6%. HEVs recorded a 26.3% increase, reflecting strong consumer interest in electrified choices.
Petrol models performed well with a 24.8% month-on-month increase, driven by continued affordability and availability. Diesel, while posting the lowest rise at 16.1%, still demonstrated strong growth for a fuel type facing long-term declines.
Despite the uplift in retail activity, the overall time taken to sell a used vehicle increased by 2.7 days to 46 days. BEVs once again led the way, taking an average of 37.4 days to sell. They were supported by fast-turning models, including the Tesla Model Y at 22.6 days and the Volvo C40 at 23.7 days.
%RVs of 36-month-old cars at 60,000km were more mixed. Month on month, the overall %RVs slipped 0.8pp to 49.1%. The value retention of petrol-powered cars fell by 0.8pp as well, to 50.5%. Meanwhile, PHEV %RVs softened by 1.1pp to 46.2%. HEVs declined marginally by 0.2pp to 53.2%. BEVs saw the steepest drop, by 1.6pp to 35.2%. Diesel was the only segment to improve, rising by 1.7pp to 57.4%.