TMT Intelligence Report
October 2022
As U.S. Households Now Subscribe to More Streaming Services than Ever, Customer Satisfaction Starts to Decline
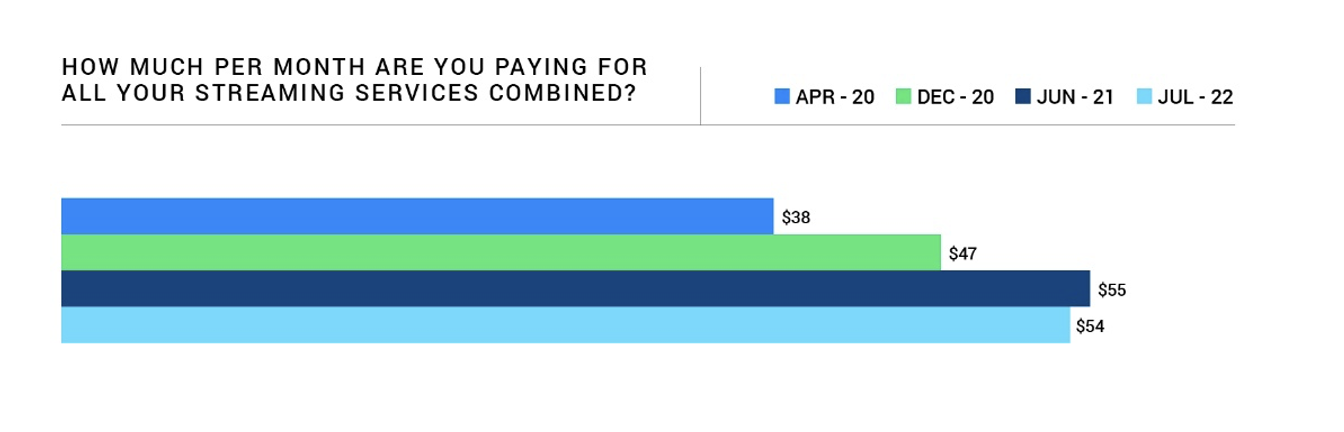
- Viewers increased their number of subscriptions, with 60% having at least four services. However, the average monthly household spend stays consistent at $54 in July 2022 vs. $55 in June 2021.
- Overall satisfaction with streaming services is declining, particularly across content quality and subscription cost, which declined the most in July 2022 from June 2021 (-0.41 and -0.38, respectively).
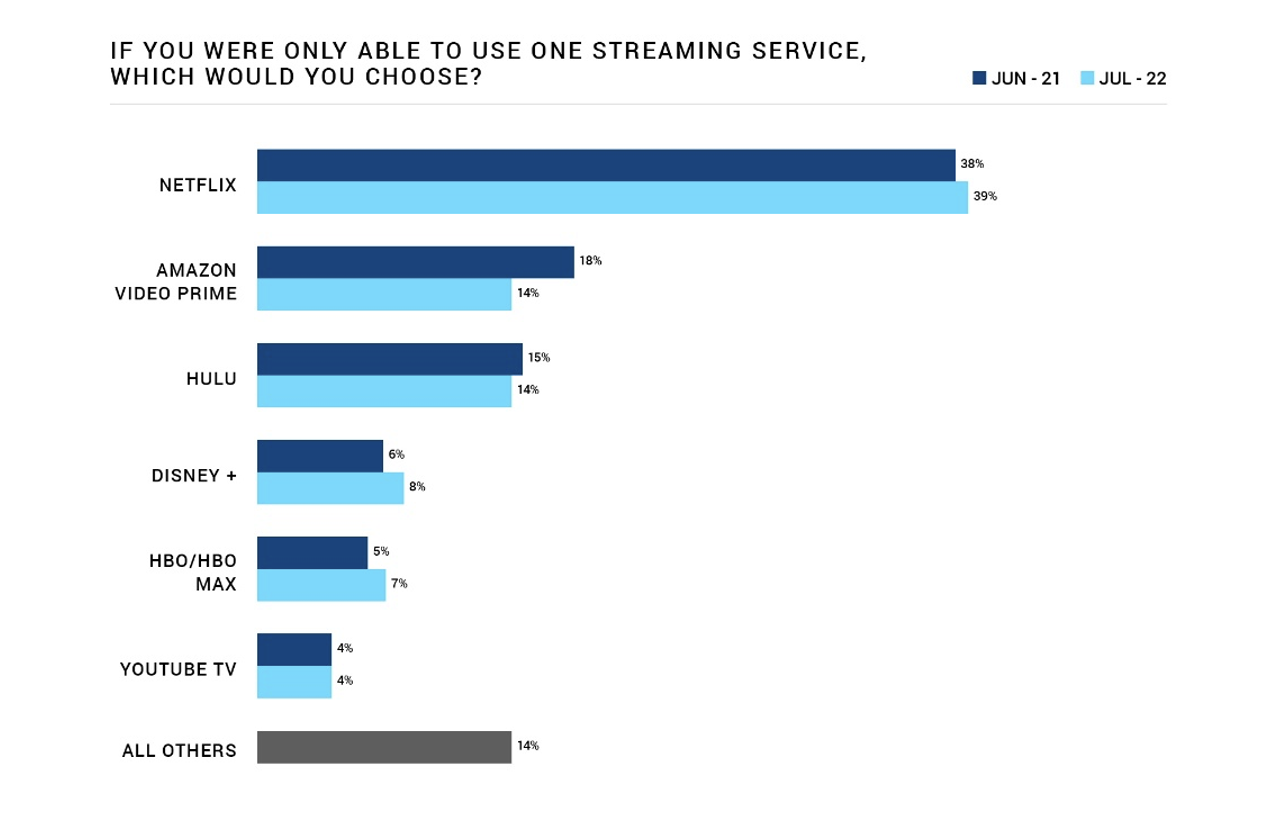
- Netflix remains the largest and most popular brand among survey respondents. More than twice as many customers (39%) chose Netflix than the next most popular services, Amazon Prime Video (14%) and Hulu (14%).
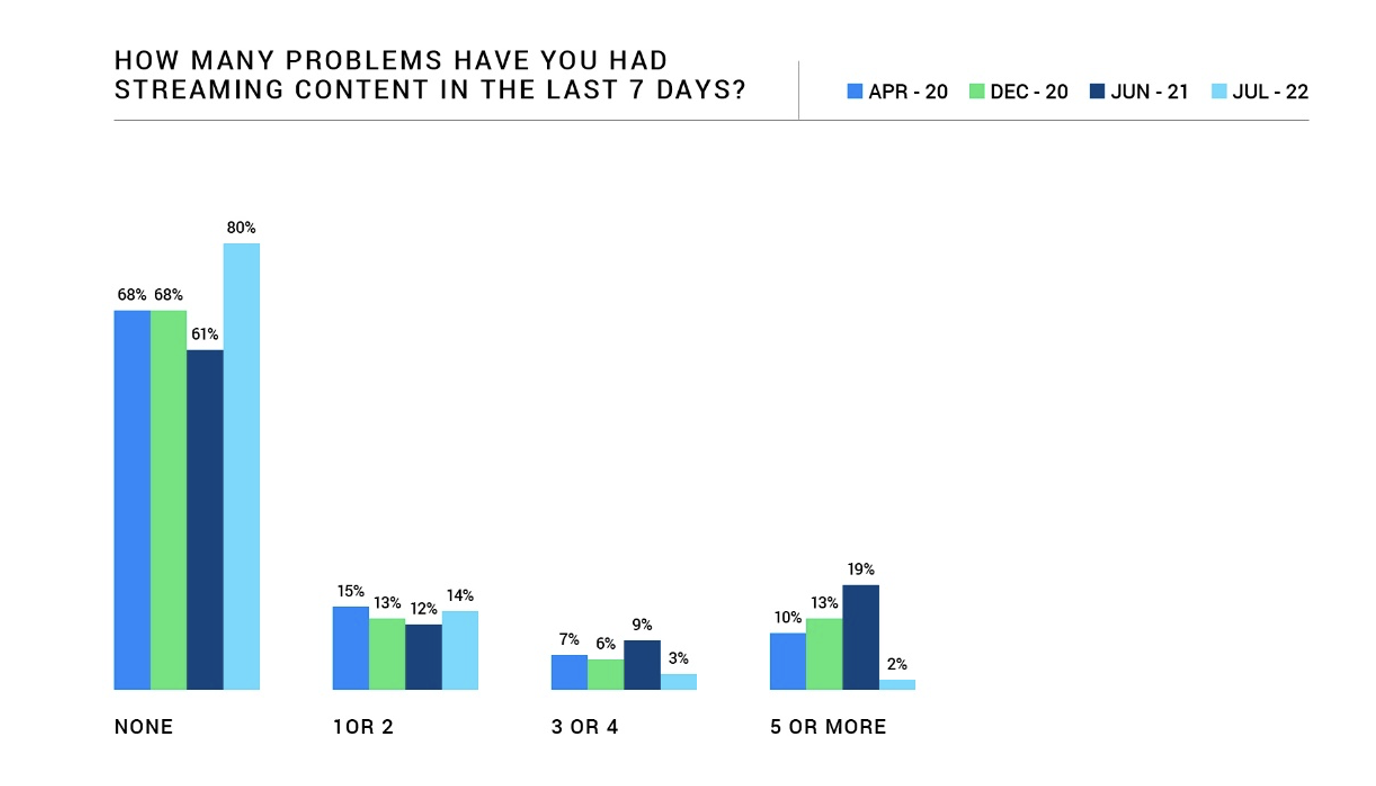
- Streaming problems decreased, with 80% of viewers reporting no issues.
Streaming services may be heading into tougher times. Not only is the competition fierce and cost of acquiring and producing content high; subscribers may be nearing their limit with how many subscriptions they carry and what they spend. To gain more insight into the state of the market, JD Power conducted a fourth installment of its streaming pulse survey in July 2022. It consists of responses from 1,287 U.S. adults who shared their viewing preferences, usability challenges and plans for using these subscription-based services. Following are the key findings.
Streaming Subscriptions May Have Peaked
As the world gradually returns to normal, loosened public health restrictions have allowed many of the hardest-hit sectors – such as live sports and entertainment, dining, and travel – to meet or exceed pre-pandemic levels of activity.
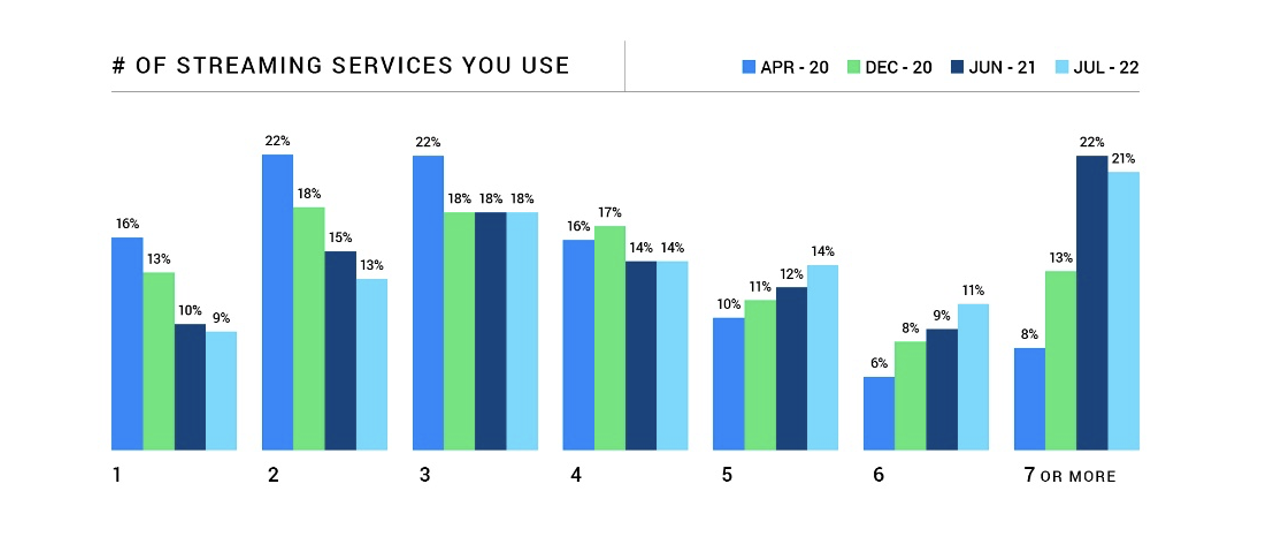
However, quarantine viewing habits persist, with customers in the United States subscribing to more streaming services than ever before.
In fact, 60% of streaming households now subscribe to four or more streaming services, up from 57% in June 2021.
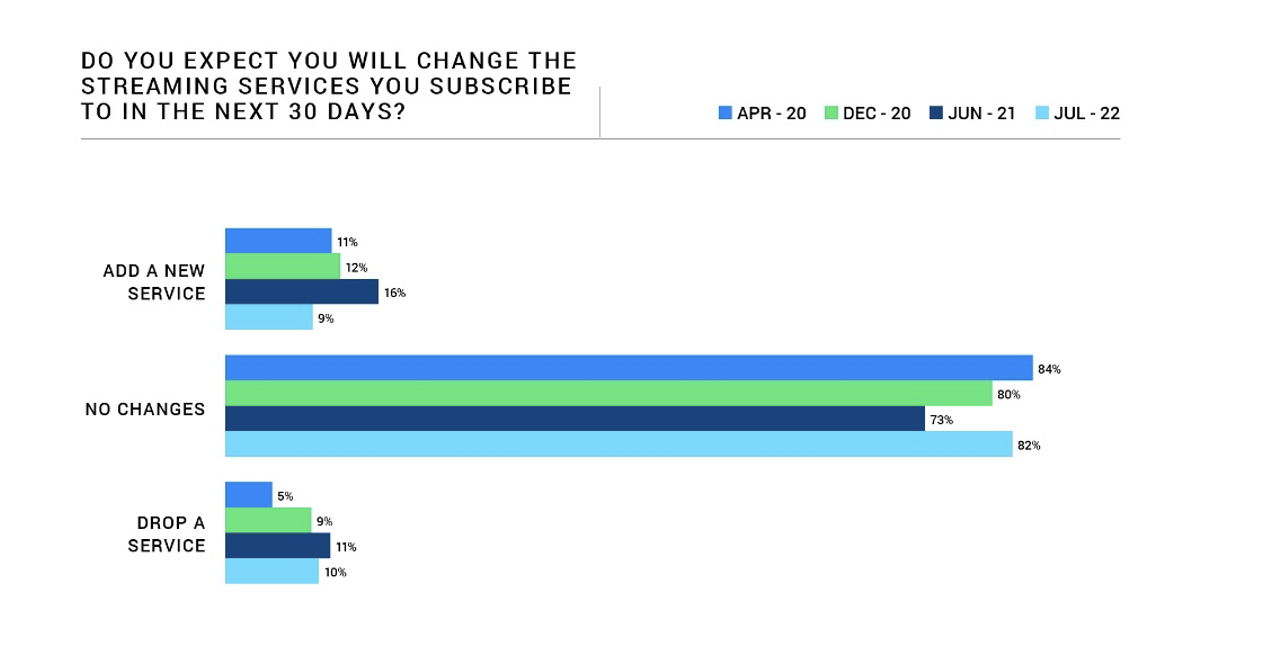
Despite this growth, subscription fatigue is gaining ground. More than three-fourths (82%) of streamers expect to maintain their current lineup and make no changes to their services during the next 30 days. Only 9% plan to add a new service.
Interestingly, an increase in the number of streaming subscriptions did not lead to higher overall reported costs.
In fact, the average reported monthly household spend on all streaming services has remained relatively consistent at $54 in July 2022 vs. $55 in June 2021.
This consistency is likely due to the bundles and affordable add-ons offered by streaming services1. For example, consumers can purchase the Disney bundle, which includes Hulu, Disney+ and ESPN+, for $13.99 a month. The package saves $11 a month compared with buying each service individually.
Customers can also save on subscription costs by taking advantage of numerous discounts and free trials. In addition to the deals offered by streaming providers themselves, wireless carriers, internet providers, big box retailers, and device manufacturers have all promoted lengthy free streaming trials to entice consumers. Verizon, T-Mobile, Cricket Wireless, Xfinity, Roku, Google Chromecast, and Walmart are just a few of the brands incorporating streaming into other products and services.
The cost plateau will be short-lived, however, as price hikes have recently been announced by multiple providers. Last month, the Walt Disney Company announced rate increases2 for each of its streaming services:
- ESPN+ jumped almost 43% in late August, going from $6.99 a month to $9.99 a month.
- Hulu’s new (and significantly higher) rate goes into effect in October. The ad-free premium plan will increase to $14.99 a month from $2 a month, while the ad-supported option will rise to $7.99 a month from $6.99 a month.
- The Disney+ ad-free plan will increase 38% in December, rising to $10.99 a month from $7.99 a month. The new ad-supported tier will also launch in December at $7.99 a month.
Additionally, next summer’s merger of HBO Max and Discovery+ will likely result in a new—and more expensive—pricing structure. During the recent Goldman Sachs Communacopia Tech Conference3, Warner Bros. Discovery CFO Gunnar Wiedenfels claimed that the company’s two most popular streaming services are “fundamentally underpriced.” Currently, the ad-free version of HBO Max is $14.99 a month and $9.99 a month with ads, while Discovery+ is $6.99 a month without ads and $4.99 a month with ads.
Groceries vs. Game of Thrones
Even as inflation problems persist and consumers spend less on non-essentials, media executives are confident that subscribers will see the value in their premium, original content.
Disney CEO Bob Chapek recently stated4 that increasing prices “even in big chunks” will not diminish its value to the consumer and that “churn implications” will be “negligible.”
Across the board, streaming providers are investing heavily in epic prequels, award-winning series returns, blockbuster movies and live sports to keep subscribers engaged and minimize churn rates.
For example, the first season of Amazon’s highly anticipated series, “The Lord of the Rings: The Rings of Power,” is estimated to have cost $715 million, making it the most expensive TV show of all time.
This costly, content-driven customer acquisition and retention strategy may create lifts in net subscriber counts, but satisfaction with streaming services declined in July 2022 from June 2021, most notably across content quality (-0.41) and subscription cost (-0.38).
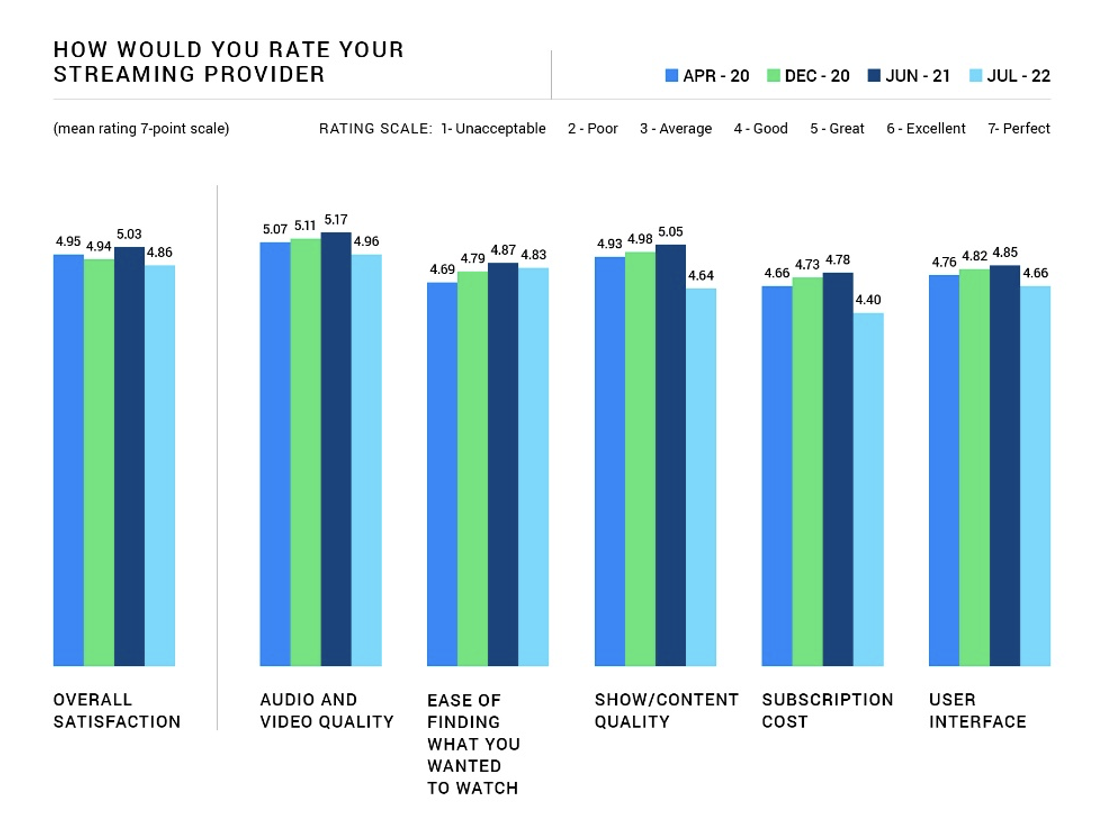
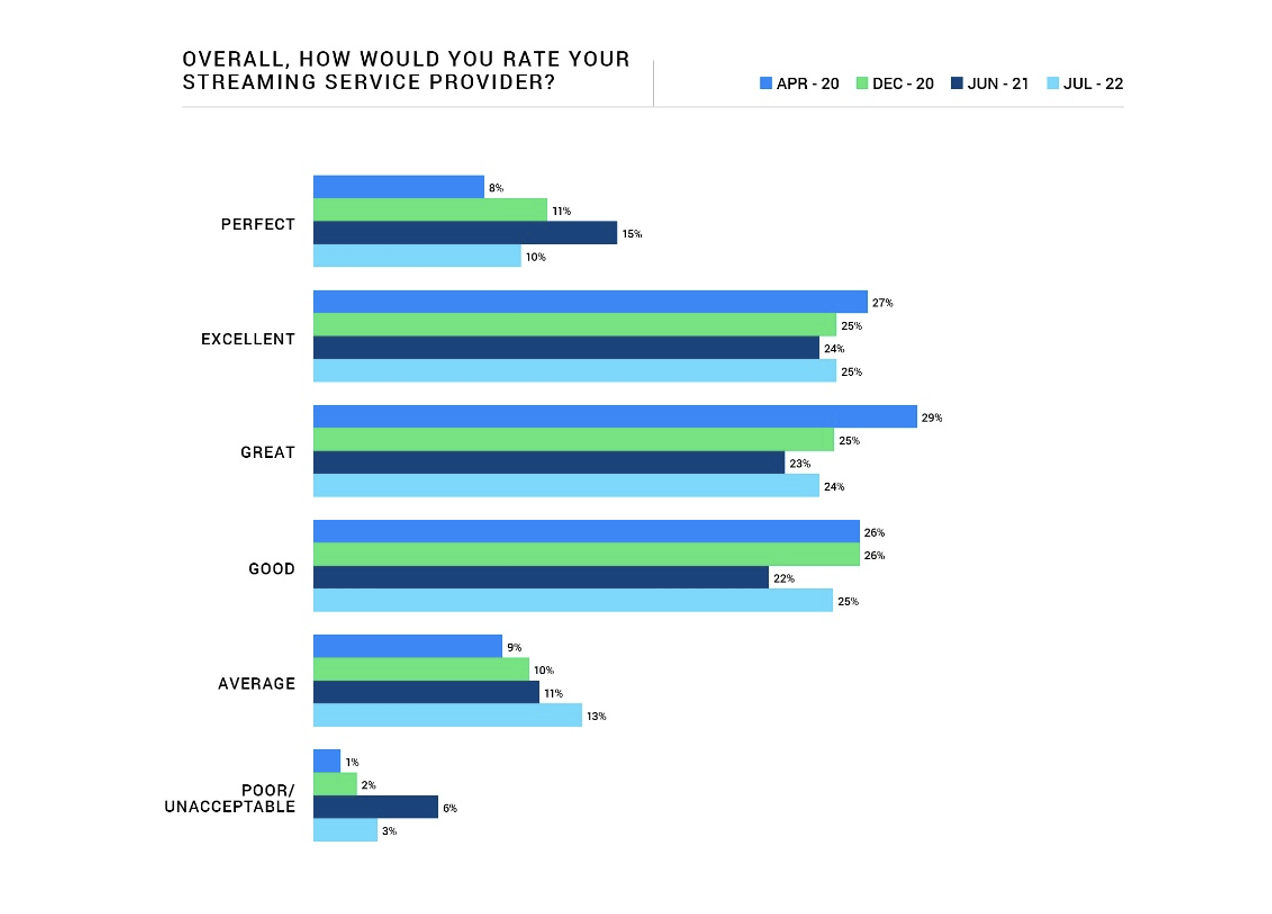
Despite only declining slightly to 4.86 in July 2022 from 5.03 in June 2021, Overall Satisfaction is the lowest since this survey’s inception. Additionally, fewer respondents considered their streaming service to be “perfect” (10% in July 2022 vs. 15% in June 2021.)
To stand out from the competition, brands might prioritize further developing an intuitive, dependable user experience that marries premium content with ease of navigation, personalized recommendations, and cross-platform reliability. It’s been said that “people make promoters, but defects make detractors;” obsessively lowering the number of streaming problems experienced reduces a common impetus for shopping other streaming services.
With subscription rates rising—and streaming satisfaction declining across the board—focusing on delivering a delightful user experience is the best way for providers to retain loyalty and drive growth.
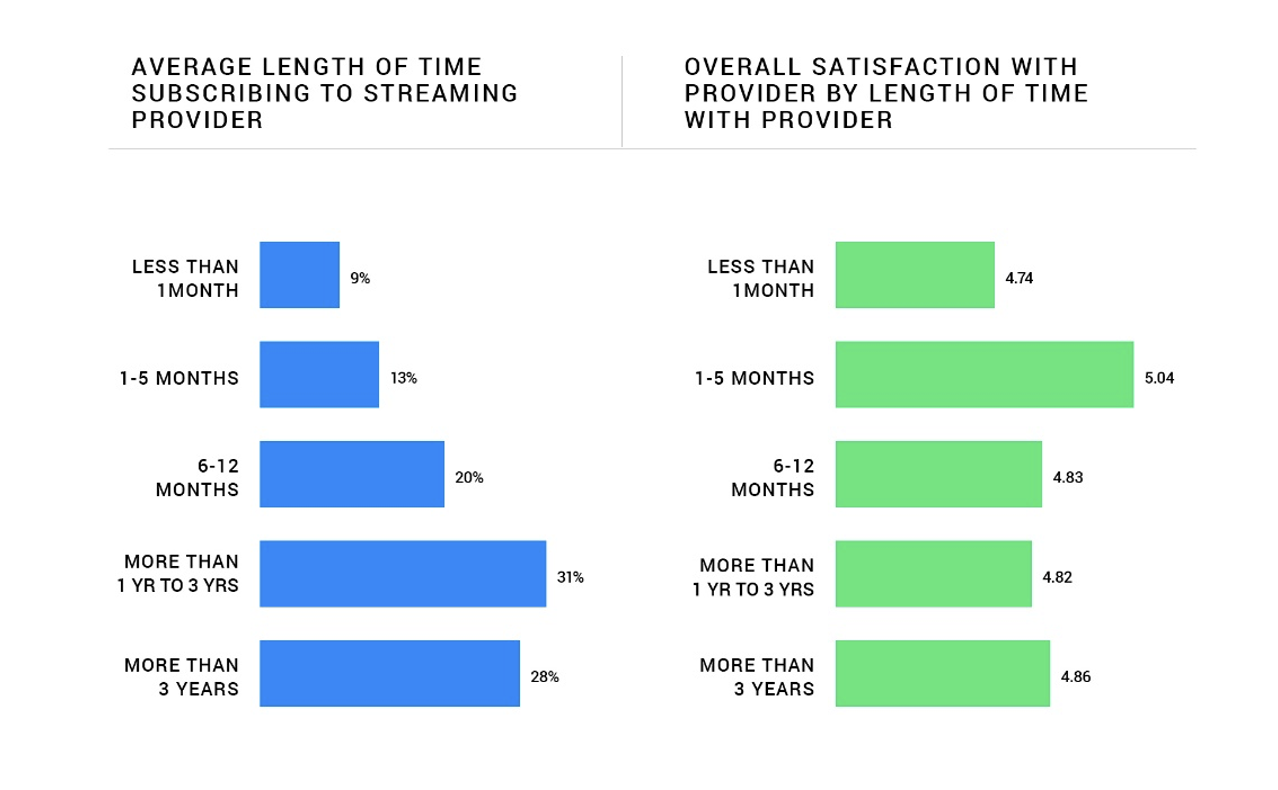
This is especially true in the churn zone – the initial stages of a subscription when customers have exhausted the content library and are most likely to drop a provider. Customers who have been with their streaming provider for less than one month are most likely to indicate they are planning to drop a streaming provider within the next 30 days (19% vs. 10% for the total industry).
Netflix Is Synonymous with Streaming
Netflix is the streaming provider respondents don’t want to live without.
Despite suffering at the hands of Wall Street and subscriber counts in the first half of 2022, Netflix is still a favorite among the public. When asked to choose only one streaming service, more than twice as many customers surveyed would choose Netflix (39%) than the next most popular selections, Amazon Prime Video (14%) and Hulu (14%).
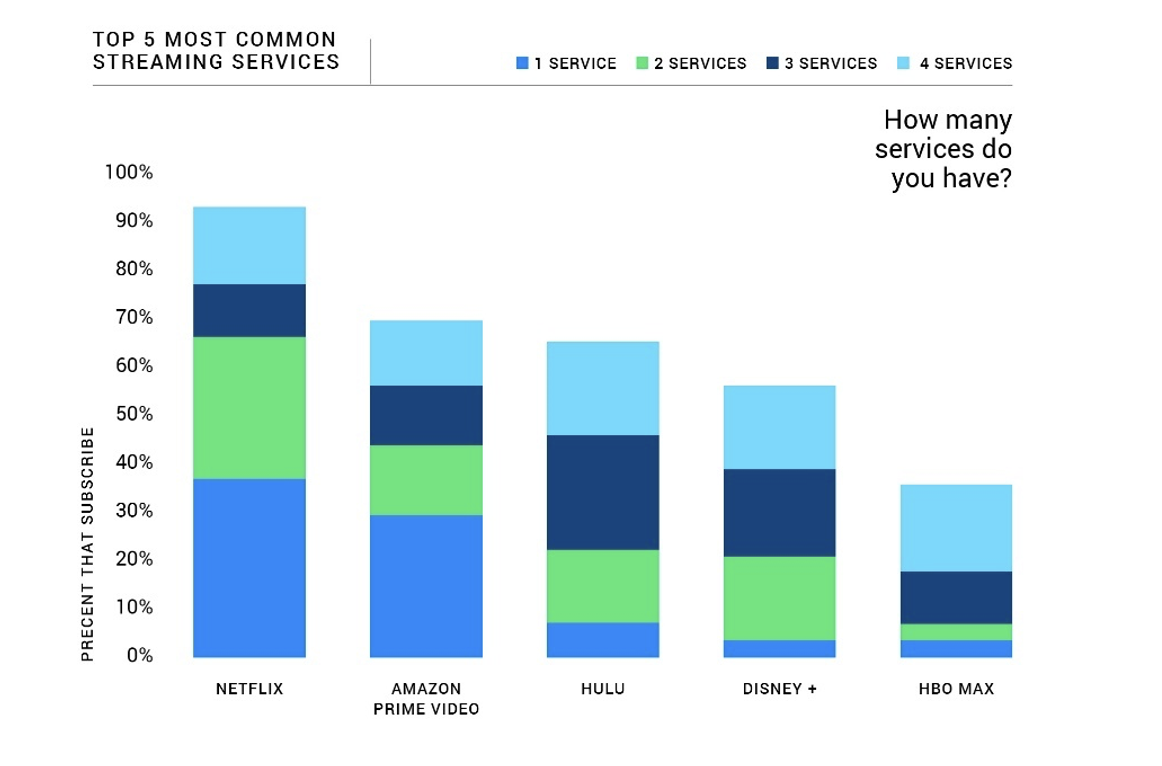
Simply put, the streaming giant has become a staple in most households. Over 90% of customers that have at least four streaming services will have Netflix.
Competition Advances on Netflix
Chrissy (Netflix), wake up! The record-breaking success of Stranger Things 4, which debuted May 27, helped Netflix maintain its market share, but competition is advancing.
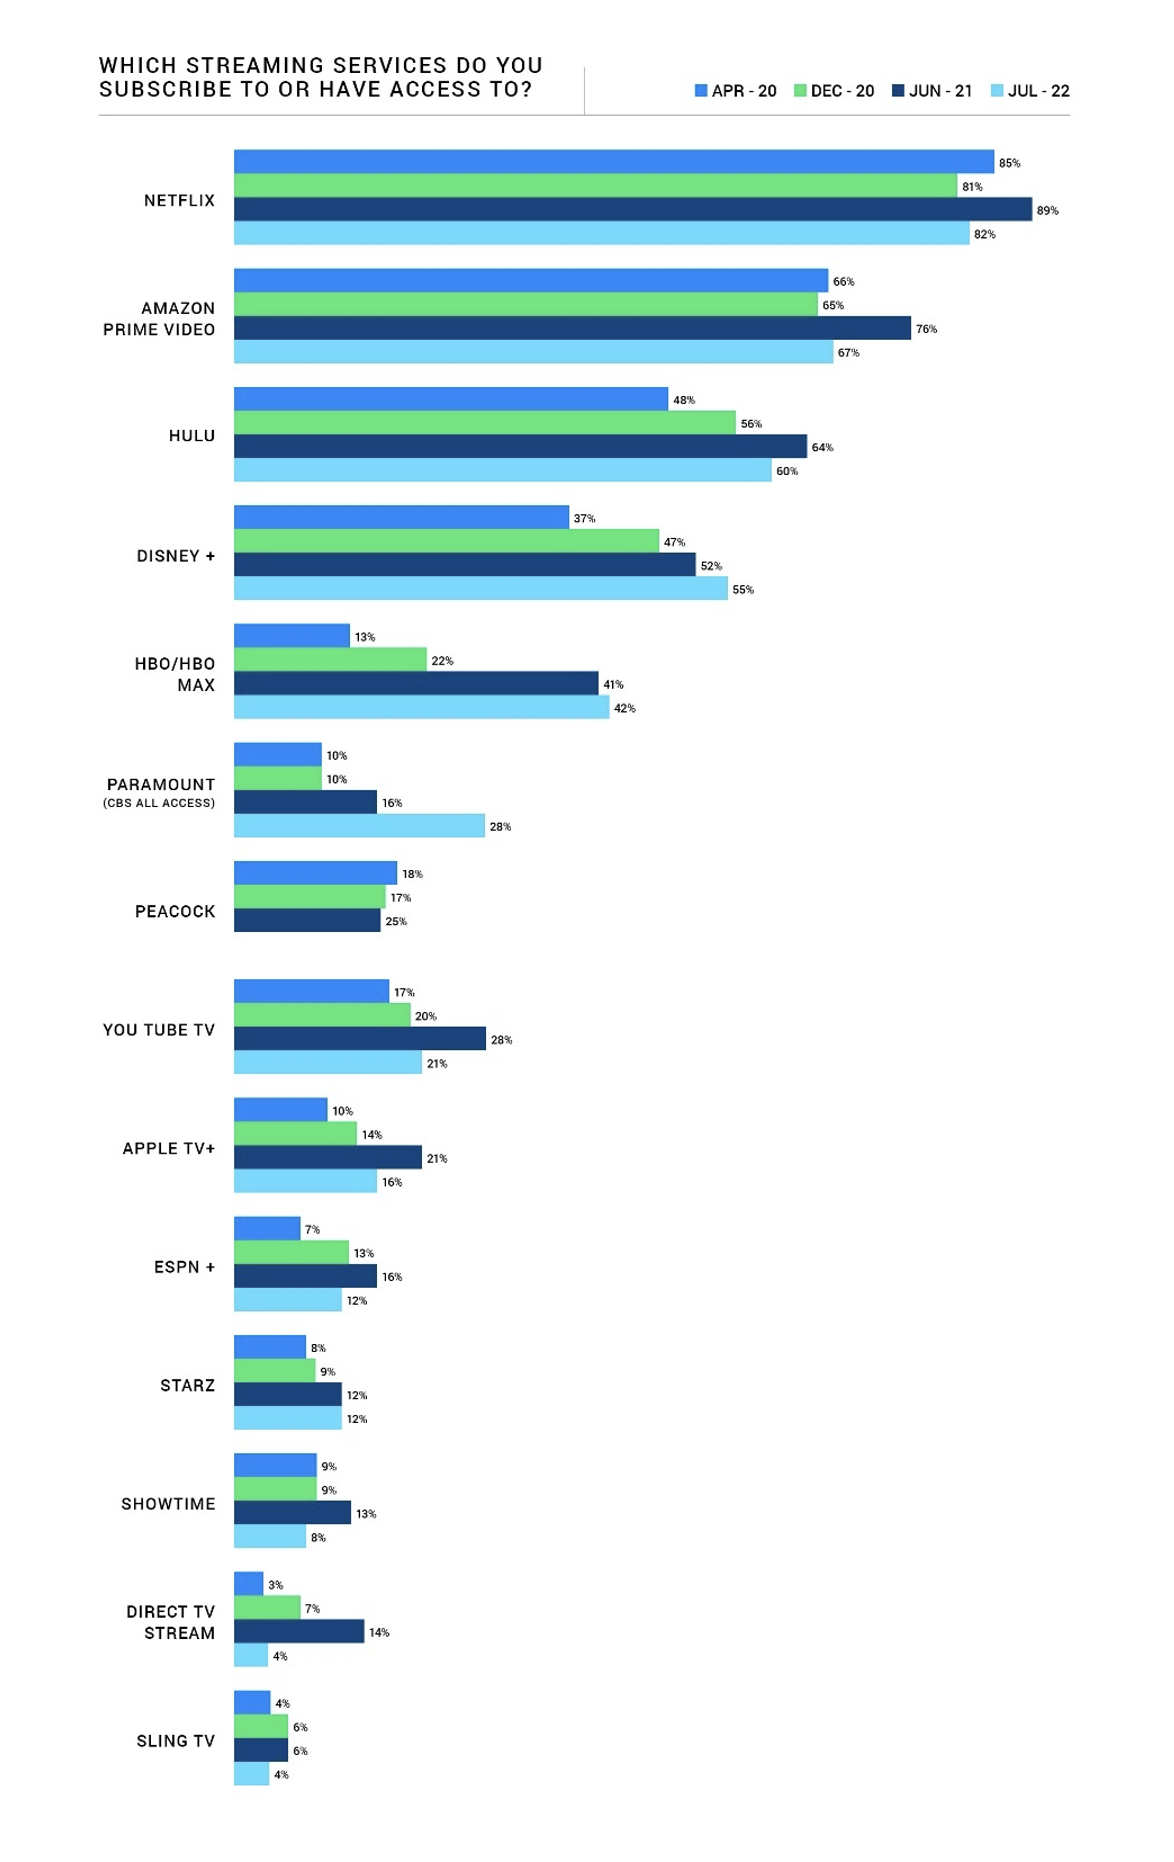
Despite a slight dip from June 2021 (and a loss of nearly 1 million subscribers in Q2 20225), Netflix remains the largest brand with 82% of respondents saying they subscribe, followed by Amazon Prime (67%), Hulu (60%) and Disney+ (55%).
The top three streaming providers all saw market share decrease from June 2021. Disney+ was the only streaming service among the top four to show gains and is quickly closing the gap.
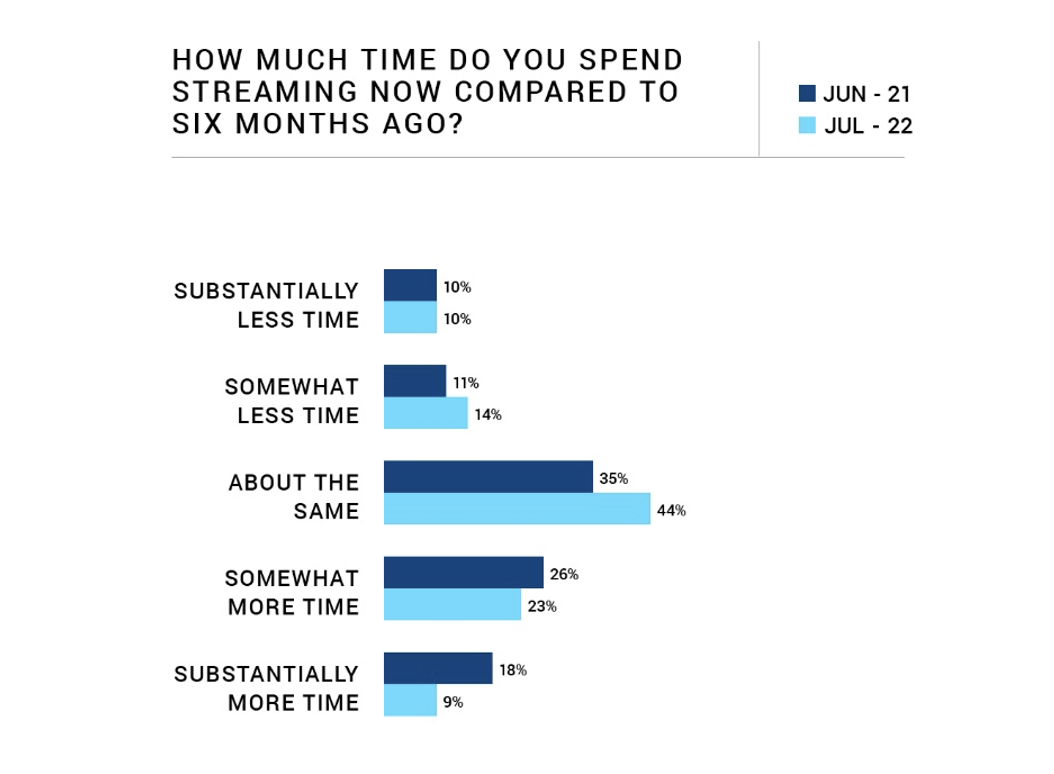
Heavy Streaming Subsides
Unsurprisingly, a return to normalcy during the past year has led to a decrease in heavy streaming.
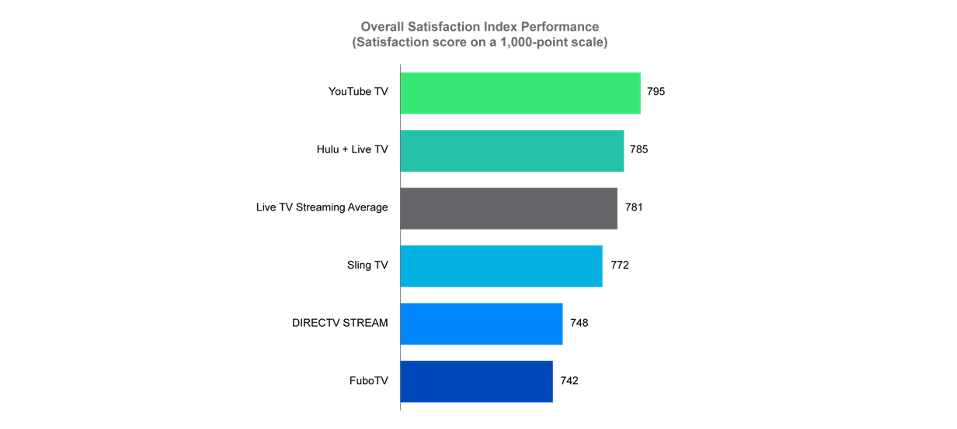
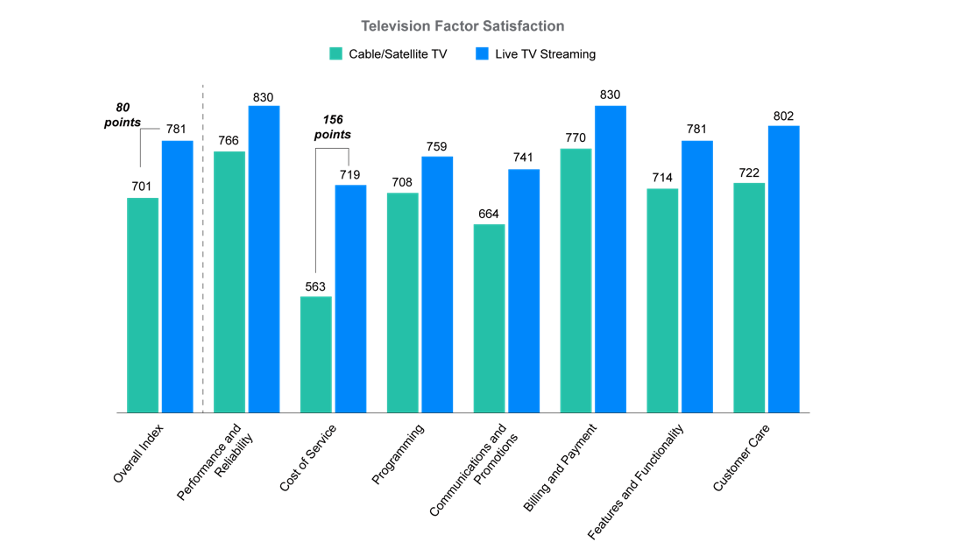
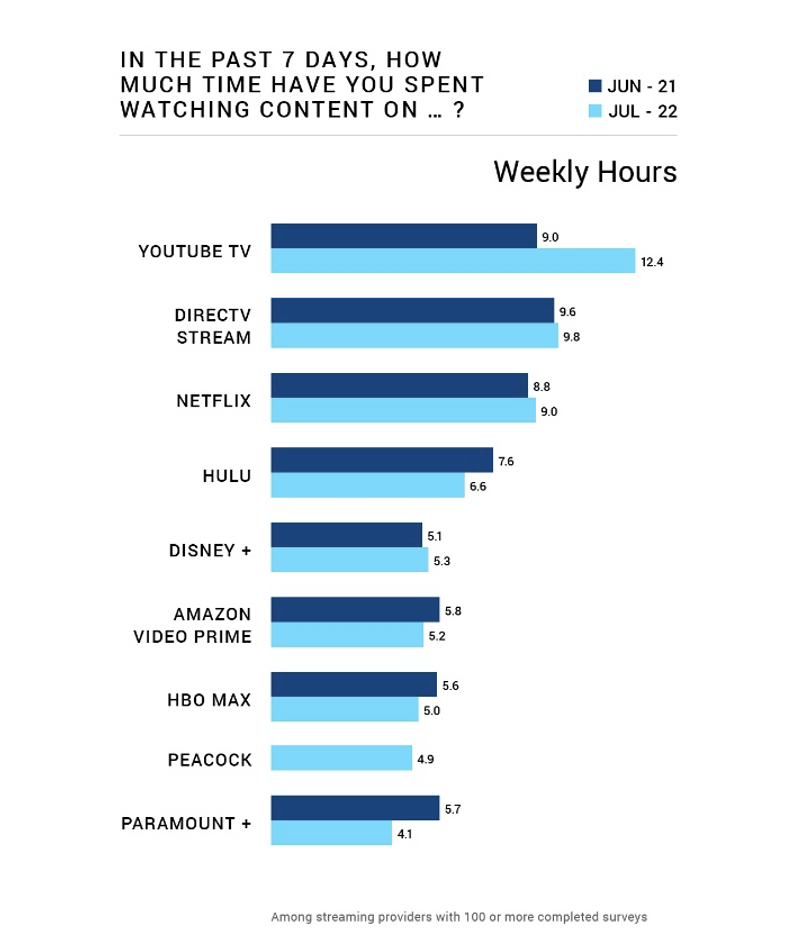
The heaviest time streaming is spent among the Live TV Streaming providers, with YouTube TV and DirecTV Stream capturing the most extensive streaming durations (12.4 weekly hours and 9.8 weekly hours, respectively).
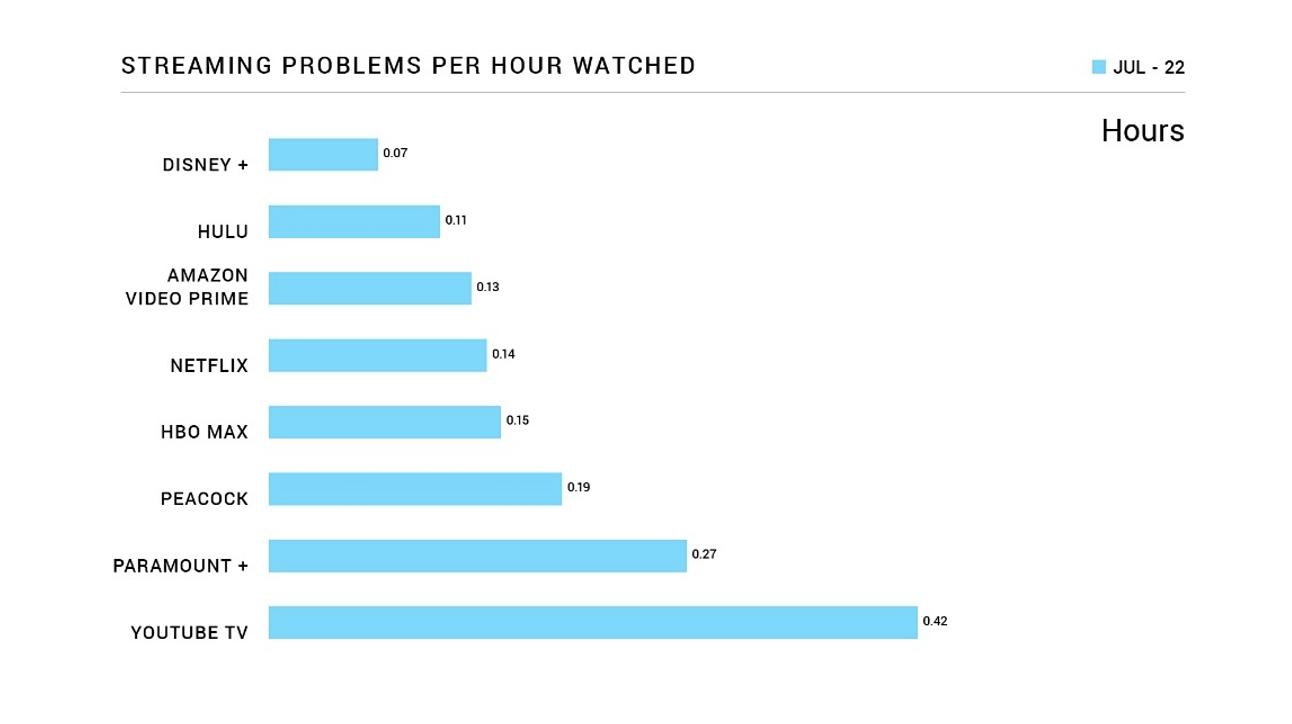
Heavier streaming time has its disadvantages, however, as YouTube TV viewers struggle the most with problems while streaming. Amazon, Disney+ and Hulu provide the most trouble-free viewership experience.
Overall, streaming problems are substantially decreasing. 80% of streamers indicate having no issues while streaming in July 2022. This is the lowest incidence of problems since fielding began.
Source 1: https://www.cnbc.com/2022/10/04/dont-expect-cable-tv-like-package-for-streaming-bundles.html
Source 2: https://www.cnbc.com/2022/08/10/disney-raises-price-on-ad-free-disney-38percent-as-part-of-new-pricing-structure.html
Source 3: https://seekingalpha.com/article/4540787-warner-bros-discovery-inc-wbd-goldman-sachs-communacopia-technology-conference-2022
Source 4: https://seekingalpha.com/article/4541086-walt-disney-company-dis-goldman-sachs-communacopia-technology-conference-2022-transcript
Source 5: https://ir.netflix.net/investor-news-and-events/investor-events/event-details/2022/Netflix-Second-Quarter-2022-Earnings-Interview/default.aspx
Find out More
This TMT Intelligence Report is based on responses from 1,287 U.S. adults who shared their viewing preferences, usability challenges and plans for using these subscription-based services. It was authored by Ian Greenblatt, managing director of TMT intelligence, and Carl Lepper, senior director of TMT intelligence. Please contact us at the numbers below to connect with Mr. Greenblatt and Mr. Lepper or to learn more about the underlying research.
Media Contacts
Brian Jaklitsch; East Coast; 631-584-2200; [email protected]
Geno Effler, JD Power; West Coast; 714-621-6224; [email protected]