E-Vision Intelligence Report
July 2023
Is U.S. EV Infrastructure Ready for the Great American Summer Road Trip? It Depends on Where You Want to Go.
Key Findings
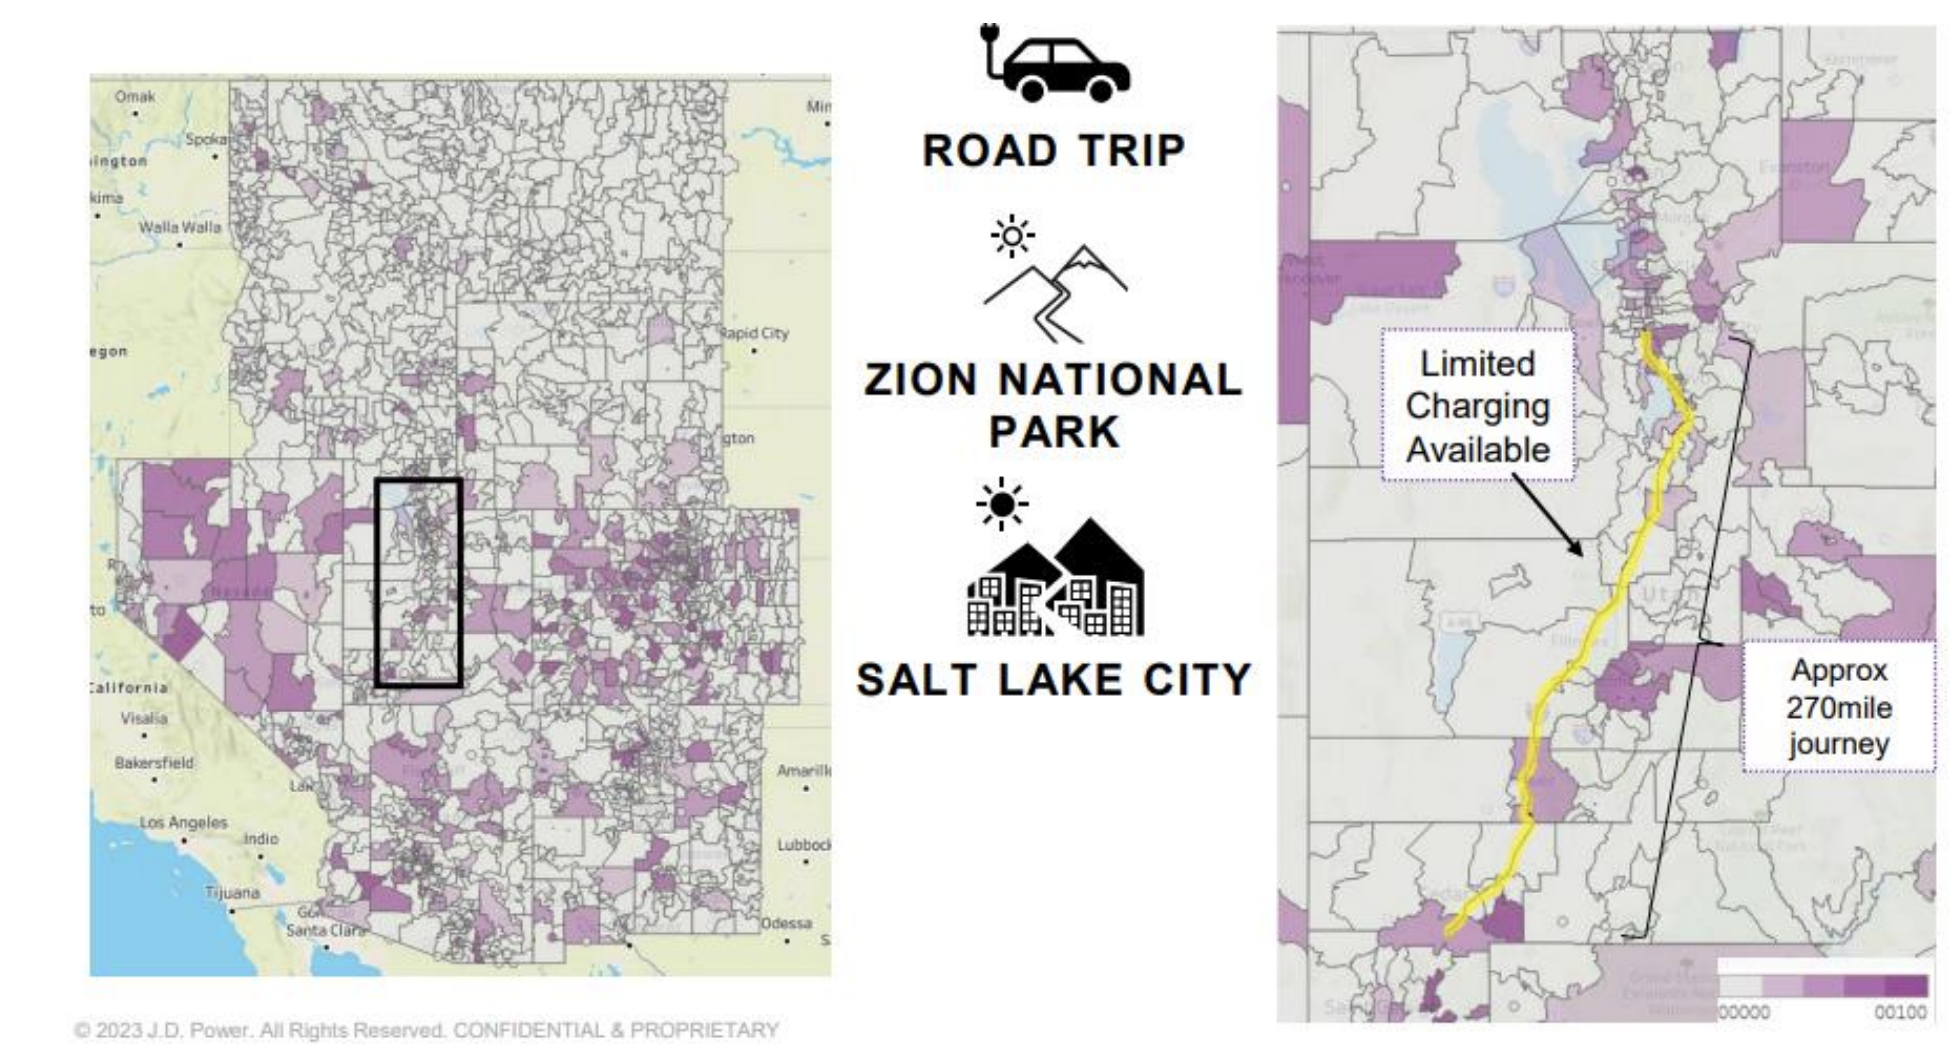
- Big Gaps in Western EV Corridor: Governors from eight Western states—Arizona, Colorado, Idaho, Montana, Nevada, New Mexico, Utah and Wyoming—committed to an initiative focused on creating an EV Corridor that will have EV charging stations within 50-100 miles of one another. Currently, many stretches between these states—and major summer tourist destinations like Zion National Park, Las Vegas and Salt Lake City—can reach upwards of 270 miles with limited charging availability, pushing the range limits of many popular EVs.
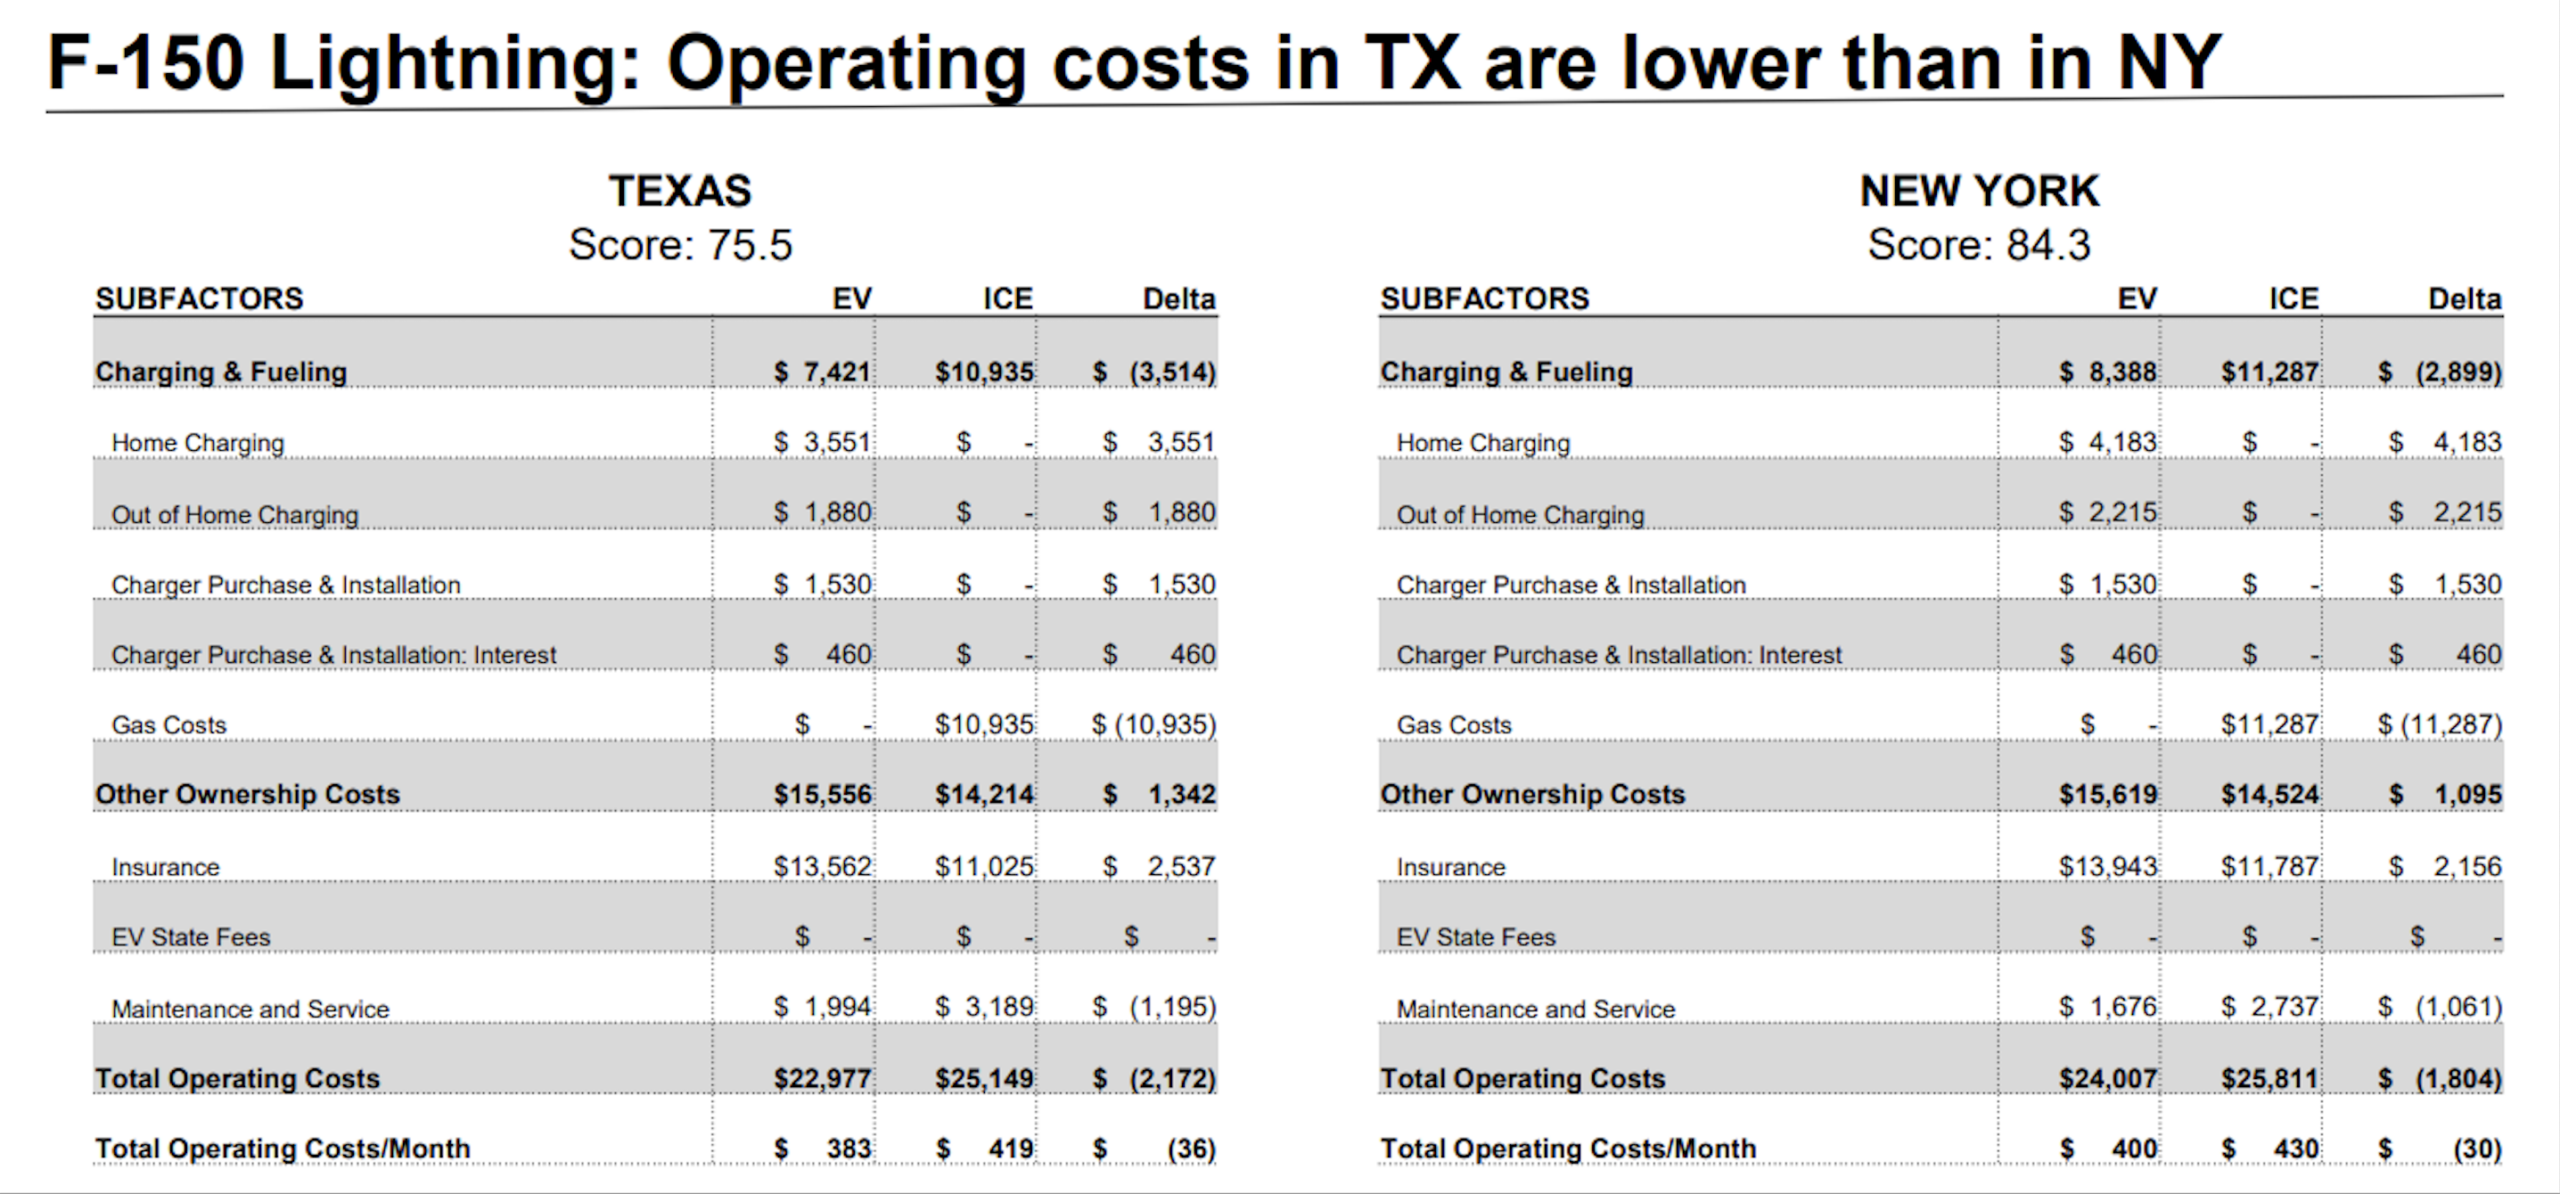
- Widespread State-by-State Variation in EV Operating Costs: The introduction of federal subsidies for EVs in the Inflation Reduction Act (IRA) has significantly improved overall EV affordability but, at the state level, ownership costs vary considerably. For example, total 5-year operating costs for the popular F-150 Lightning is $1,010 cheaper in Texas than New York.
- Rivian Rises in the EV Pickup Discussion: Although the Ford F-150 Lightning is among the top vehicles considered, the Rivian R1T is gaining sales traction that puts it on par with F-150 Lightning sales for the past four months.
Executive Summary
Some 43.2 million people jumped in their cars for a summer road trip this July 4 weekend, according to AAA data, an increase of 2.4% during the past year and 4% higher than 2019. With record crowds continuing to swarm the nation’s national parks, hot spots like Zion, Yellowstone, Arches and others have made the western U.S. the ultimate destination for the Great American Road Trip. Which begs the question: Can you conquer the epic Western journey in an electric vehicle (EV)?
Right now, the answer to that question really depends on your route. While several initiatives have been launched nationwide to spur EV infrastructure growth and make charging stations available across all major transportation corridors, there are still some big gaps in existing EV charging infrastructure.
This E-Vision Intelligence Report dives into key data points trending in each monthly EV Index update, along with other data points gathered from JD Power studies and pulse surveys, to spotlight emerging trends and important shifts in EV consumer sentiment.
Go West! But Check a Charger Map First
Nationwide, consumer EV adoption continues to outpace charging infrastructure growth. According to the JD Power EV Index, infrastructure scores are down 4 points (on a 100-point index) in May 2023 vs. the same period in 2022. Charger availability continues to vary widely by state, with some states, like California, offering an average distance between charging ports of just 10 miles, and others, like Nebraska, stretching that average distance between chargers to 465 miles.
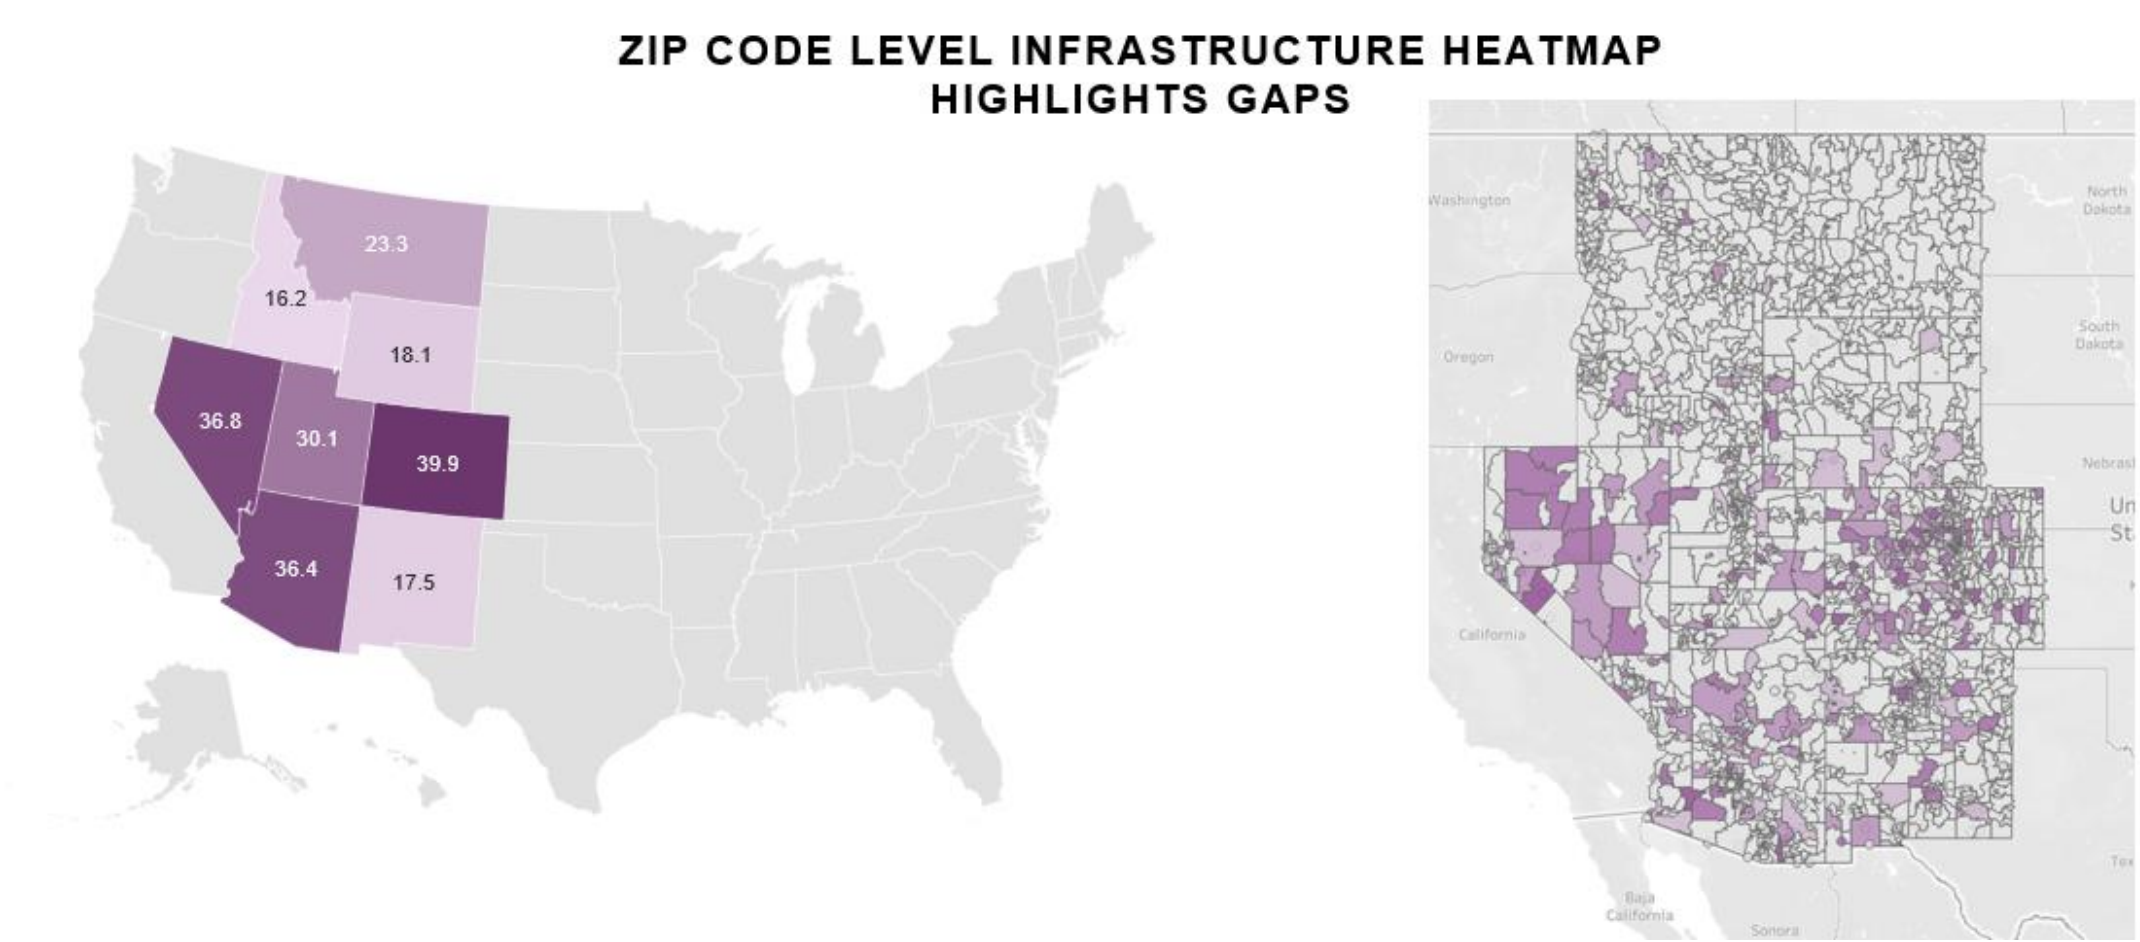
That widespread variability of infrastructure puts the focus squarely on rural Western states like Arizona, Colorado, Idaho, Montana, Nevada, New Mexico, Utah and Wyoming, which are prime destinations for summer road trippers out to visit the national parks and other bucket list destinations. In October 2017, the governors of these eight states signed a pact to work together to make it possible to seamlessly drive an EV across the western states’ major transportation corridors. This initiative set out to make charging stations available within every 50-100 miles, ensure they were accessible within 0.5 miles of a highway interchange or exit, and introduce other standards to make EV charging infrastructure ubiquitous.
According to JD Power EV Index data, they still have a long way to go. Through May 2023, the eight western states had a combined Infrastructure score of just 27.3, which is 7.7 index points lower than the national average. Colorado leads the way with a score of 39.9 and Idaho is lowest with a score of 16.2.
Digging deeper, we find that some major routes could test the range limits of many current EVs. The route from Salt Lake City to Zion National Park, for example, is a 270-mile stretch in which EV charger availability is extremely limited.
Cost of Ownership Varies by State
It’s not just charging infrastructure availability that varies considerably on a state-to-state basis. While overall affordability scores are up 2.3 index points this month, some significant gaps are starting to emerge in total ownership cost at the state level. Largely driven by energy costs and variation in state incentives, total five-year operating costs for the F-150 Lightning is $1,010 higher in New York than it is in Texas, for example.
Digging into specific EV models and specifications, costs vary even further. The Ford F-150 Lightning, for example, which is seeing the highest sales volumes in California, Florida, New York and Texas, varies in average total cost of ownership on a five-year purchase from a low of $82,740 in New York to a high of $94,031 in Texas, based on pricing calculated prior to Ford’s recently announced price cuts on the F-150 Lightning.
Speaking of Pick-Ups…
Any discussion of Great American Road Trips and the American love affair with the pick-up truck would not be complete without acknowledging recent sales and consideration trends in the category. The Ford F-150 Lightning has consistently scored high marks in terms of EV shopper consideration and currently ranks as the most-considered EV in the country this month. Not to be overlooked, however, the Rivian R1T has increased deliveries and has been giving Lightning a run for its EV truck sales crown over the last four months. It does raise the question of whether an upstart EV brand can compete in the land of the Big Three full-size pick-up.
Methodology
This JD Power E-Vision Intelligence Report is based on data and insights from the JD Power EV Index, the JD Power 2023 U.S. Electric Vehicle Experience (EVX) Public Charging Study, and the JD Power 2023 U.S. Electric Vehicle Consideration (EVC) Study. The JD Power EV Index is an analytics tool to benchmark the growing EV market in the United States. It tracks millions of data points aggregated into six categories—interest, availability, adoption, affordability, infrastructure and experience—to evaluate the progress to parity of EVs with ICE vehicles in the U.S. Each month, the JD Power electric vehicle practice will analyze these data points, and others to spotlight emerging trends and important shifts in consumer sentiment that are helping to define the fast-moving EV marketplace.
Find out More
This report was authored by Elizabeth Krear, vice president, electric vehicle practice; Brent Gruber, executive director, electric vehicle practice; Stewart Stropp, executive director, electric vehicle practice; and Kristen Richter, senior manager, electric vehicle practice. The JD Power E-Vision initiative is a company-wide program focused on maximizing JD Power industry-leading EV data, analytics, insights and solutions. Please contact us at the numbers below to connect with the authors or to learn more about the underlying research.
Media Contacts
Shane Smith; East Coast; 424-903-3665; [email protected]
Geno Effler, JD Power; West Coast; 714-621-6224; [email protected]