The French new-car market started 2026 with two months of decline, followed by a comeback in March. What happened to registration figures in April, and why? Autovista24 editor Tom Geggus explores the market.

France saw 138,339 new cars registered last month, according to PFA and AAA Data. This meant the market dipped by 0.3% compared with April 2025. This marginal result brought the year-to-date volume to 539,895 units, down 1.6% year on year.

A consistent trend in the April and cumulative figures is the positive performance of one powertrain. Battery-electric vehicles (BEVs) recorded double-digit increases across both time spans, while other technologies struggled.

The all-electric powertrain has consistently been the second-most popular in the country after hybrids, accounting for full and mild versions. But what has driven this popularity, and how has it affected different models?

French BEV boom?

BEVs accounted for 26.2% of new-car deliveries in France last month, Autovista24 analysis of PFA and AAA Data figures reveals. The powertrain’s share increased by 7.8 percentage points (pp), an unrivalled gain. It was also the only major powertrain to record growth, as registrations climbed 41.8% year on year to 36,219 units.

This has been a consistent pattern across the first four months of 2026, reflected in the year-to-date results. BEV registrations increased by 48.2% year on year to 148,302 units, capturing 27.5% of the market, up 9.3pp.

Many factors have contributed to the increasing popularity of BEVs. Rising fuel prices have pushed some buyers away from internal-combustion engines (ICE) towards electrified powertrains.

An increasing number of more affordable all-electric models has also bolstered uptake. EV Volumes revealed the market is seeing high demand for locally-made models such as the Renault 5 and the Renault Scenic E-Tech.

This ties into the income-dependent ‘coup de pouce’ incentive scheme. The programme grants funds based on a BEV’s environmental score, with production location playing an important part in this grading. In October last year, a supplementary premium was added to the scheme for models made in the EU.

However, this incentive cannot be accessed alongside one of the most significant motivators in France: the social leasing programme. The scheme’s second round met its target of 50,000 allocations in January this year. However, it continues to influence registrations as BEV deliveries are fulfilled.

The first round saw all allocations accounted for in roughly six weeks. The second ran from the end of September 2025 to January 2026. With the third round expected in July, how quickly the latest funds are allocated will help signpost demand.

Electrified French market

Other electrified powertrains did not perform as well as BEVs in April. Autovista24’s analysis of PFA and AAA Data’s figures reveals plug-in hybrid (PHEV) deliveries fell by 13.1% in the month. These 8,333 units equated to a 6% market share, down 0.9pp.

This was the powertrain’s most dramatic decline so far in 2026, pushing the year-to-date results down further. With 27,917 deliveries, PHEV registrations fell by 4.3% year on year. This took its market share to 5.2%, down 0.1pp.

Hybrids’ decline was not as severe. In April, the powertrain saw registrations fall by 4.6% year on year to 60,163 units. This meant the technology was still the country’s most popular, accounting for 43.5% of all deliveries, down 2pp.

This drop was softened by a positive performance in March, as hybrids managed 1.1% growth in the year to date. Powering 250,064 new cars, it took a market share of 46.3%, up 1.2pp year on year.

Combining BEVs, PHEVs and hybrids, the electrified category accounted for 75.7% of the French new-car market in April. This 4.9pp increase reflected a 6.6% increase in registrations, with 104,715 electrified new cars hitting the roads.

Thanks to the positive performance of BEVs, the year-to-date result was even better. With 426,283 registrations, deliveries of the powertrain grouping grew by 13.2%, capturing 79% of the market, up 10.4pp.

All over for ICE?

This gain for electrified vehicles was proportionately reflected in the ICE results in the year to date. Combined registrations of pure petrol and diesel models accounted for 17.5% of the new-car market, down 10.1pp.

Between January and April, ICE deliveries fell by 37.8% to 94,304 units. This followed a 27.6% decline in April to 25,798 registrations as the grouping’s market share slid by 7.1pp to 18.6%.

While diesel saw the larger decline in percentage terms during April, petrol recorded a greater volume loss. Deliveries of the former fell by 42.8% to 3,835 units, taking a 2.8% market share, down 2pp. On the other hand, petrol suffered a 24.1% drop to 21,963 units. With 6,969 fewer models taking to the road, the fuel type’s share shrank by 5pp to 15.9%.

In the year to date, petrol registrations sank even lower, down 36.6% to 80,403 units. This equated to 14.9% of the market, down 8.2pp. Meanwhile, diesel recorded a fall of 44% to 13,901 models, accounting for 2.6% of all deliveries, down 1.9pp.

Two questions now stand out. Will the third social leasing round prove as popular as the first, given higher petrol and diesel fuel prices? If so, will this change in consumer sentiment become concrete? The answer to the first question will be revealed in a few short months and will set the stage for the second.  

Battery-electric vehicles (BEVs) reached a new milestone in the UK during April. But as petrol rebounded and plug-in hybrids (PHEVs) rose, can the technology make its mark in an ageing car parc? Autovista24 special content editor Phil Curry examines the data.

There were 149,247 registrations in April, according to the latest data from the SMMT. This was up by 24% compared with the same period last year. The result was buoyed by a rise in petrol deliveries, while electrified models continued their positive performance.

However, the increase in figures came after a low result in April 2025. A change in the UK’s vehicle excise duty (VED) saw many registrations pulled forward earlier. Therefore, an accurate year-on-year comparison is more difficult this month.

The SMMT has also revised its forecast for the year. Registrations are now expected to reach 2.09 million units, equating to a year-on-year increase of 3.6%. This was up from January’s 2.05-million-unit outlook. Further growth is expected in 2027, with the market forecast to reach 2.12 million units.

ICE inspires UK market

The UK’s internal-combustion engine (ICE) market has been struggling for some time. April did represent a stronger performance, but it was not enough to prevent it from slipping behind electrified powertrains.

Combined petrol and diesel deliveries saw growth of 7.3% in the month, driven by petrol. While diesel saw yet another decline, its volumes remained broadly stable year on year.

In contrast to other big European markets, the SMMT reports its mild-hybrid (MHEV) powertrain figures differently. Rather than mixing them in with full hybrids (HEVs), they are included with their respective petrol and diesel counterparts. This can make the UK figures appear distorted compared with other market trends.

Even with the MHEV numbers included, ICE registrations have seen steady decreases. However, 2026 seems to be altering this trend.

In April, petrol volumes increased by 8.2% to 63,541 units. The result equated to a 42.6% market share. However, with other powertrains increasing, this was down by 6.2 percentage points (pp). This was the second time in 2026 that petrol deliveries rose, as it held on to the leading market share.

Across the first four months of 2026, a total of 340,230 petrol models have been registered. This marked a decline of just 1.5% year on year. While the fuel type still leads the market by volume, its 44.5% share was down 4.8pp.

Diesel drops but remains stable

Diesel deliveries fell 1% in April. However, the 6,314-unit delivery total was only down by 67 units year on year. However, its 4.2% market share was down by 1.1pp.

Between January and April, diesel saw a decline of 8.4% to 36,827 registrations. Meanwhile, its 4.8% share of the market total was down 0.9pp.

Despite petrol’s positive performance and diesel remaining relatively stable, ICE was unable to remain the dominant powertrain grouping. Its 46.8% share in April was down 7.3pp. In the first four months of the year, a 2.2% volume decrease saw its share slip 5.7pp, to 49.3%.

Can EVs overcome concerns?

The first quarter of the year saw slightly slower BEV registrations. This was likely due to the pull-forward effect from last year. Compared to a slightly reduced performance in April 2025, deliveries increased 59.1% year on year. In total, 39,084 units left showrooms in April, giving the technology a 26.2% market share, up 5.8pp.

BEVs became subject to vehicle excise duty (VED) from April 2025. Buyers rushed to register their vehicles before then, creating a pull-forward effect. This means the market has been playing catch up in 2026.

Across the first four months of 2026, all-electric deliveries increased by 22.1%, to 176,698 units. So, BEVs held 23.1% of the UK new-car market, below the 33% zero-emission vehicle mandate target due by the year.

The SMMT’s 2026 BEV share forecast has been downgraded after the weaker first quarter. The powertrain is expected to account for 26.8% of the market, down from 28.5% estimated in January.

In 2027, BEVs are forecast to reach a 32% market share, 6pp below the mandated target of 38%. While BEVs celebrated two million cumulative registrations, the forecast distance from the 2026 and 2027 targets is a concern.

‘Other major international markets are revising their transition plans to reflect geopolitical and market realities. The UK similarly needs an urgent review of the transition to avoid being put in an uncompetitive position, undermining consumer choice, investment and growth,’ the SMMT highlighted.

PHEVs prove popular in the UK

PHEVs continued their strong performance with a 46.4% registration increase in April. In total, 20,597 new units made it to UK roads. This marked the first time since August 2025 that the powertrain recorded a higher volume than HEVs.

The PHEV sector has been growing in strength this year. In all, the technology commanded 13.8% of April’s overall figures, up 2.1pp. Four months into the year, PHEVs saw growth of 46.5%, the best-performing powertrain in terms of volume increase. With 99,263 units, it held 13% of the market, up 3.3pp.

This result meant that the electric vehicle (EV) market saw a 54.5% year-on-year rise in April, taking a 40% market share. This was a jump of 7.9pp compared to the same point last year. Between January and April, EV registrations increased by 29.9%, with a 36.1% market share, up 5.8pp.

HEV slowdown continues

In total, 19,711 HEVs were registered last month, an 18.8% improvement. This allowed a 13.2% market share, but with better BEV and PHEV performances, this was 0.6pp lower than April 2025.

The HEV market has been a slow burner so far in 2026, with cumulative figures up 8.3% year on year. As 111,083 units joined the roads, the technology held a 14.5% share of the UK total, down 0.1pp.

Combining HEVs with EVs, the electrified market was ahead of ICE for the second successive month. With 79,392 registrations, the grouping was up 43.8%, taking a 53.2% hold in April. This also helped the technology jump ahead after four months of the year. Its 387,044 deliveries were up by 22.8%. This provided a slim lead with a 50.7% share, following a dead split across the first quarter.

With ICE deliveries experiencing a rollercoaster 2026, it is not clear how quickly electrified registrations could pull ahead. But as the market experiences more growth, April may well be the tipping point for ICE.

UK car parc ages again

The SMMT recently released its overview of the UK car parc, providing insight into the roads in 2025. In total, 36,676,185 cars were in use in the UK last year, a rise of 1.4%.

Petrol cars remained the most dominant, with a 57.7% share of the market. This was down by 0.5pp compared with 2024, according to Autovista24 analysis. Meanwhile, diesel still held 30.1% of the UK total parc, a drop of 2pp year on year.

Electrified models continued to see increases, although they made up a small percentage of overall cars in use. BEVs took a 4.9% share, up by 1.2pp year on year. HEVs took 4.7% of the parc, a rise of 0.7pp, while PHEVs took a 2.6% share, up by 0.6pp.

The UK’s car parc is also getting progressively older, as drivers hold on to their vehicles for longer. The average age for a passenger car in the country rose to 9.7 years in 2025.

This is thanks in part to an increase in the number of cars that are over 12 years old. Last year, 33.1% of the parc made this threshold, a rise of 1.4pp year on year.

The number of 3-6-year-old cars reached 13%, a decline of 2pp, while those aged 7-9 years made up 18.6% of the parc, a drop of 1.2pp. Cars between 10-12 years made up 19.3%, a rise of 0.8pp.  

Residual values (RVs) remained broadly stable across European used-car markets in April. But what did other metrics reveal in Austria, France, Germany, Italy, Spain, Switzerland, and the UK? Autovista24 editor Tom Geggus examines the market data.

Passenger car values in key European markets remained relatively stable in April. While there was an overall trend of decline compared with March, value drops were mostly marginal.

The UK saw the largest decline in absolute RVs, down 2.3% month on month to £15,460 (€17,924). With the exception of Austria’s 1.8% fall to €22,623, nearly all other observed markets recorded drops under 1%. Spain was even able to record a 0.9% increase in absolute RVs compared with March.

RVs presented as a percentage of retained list price (%RV) after 36 months and 60,000km also remained stable in April. Compared with March, the UK once again saw the largest drop, from 48.4% to 47.4%.

Declines in %RVs were more substantial compared with April 2025. Italy recorded the largest decline, down 3.8 percentage points (pp) to 44.6%. Meanwhile, all markets saw list prices and active-market volume indices (AMVI) climb year on year, putting pressure on %RVs.

Austria sees more momentum

Austria’s sales‑volume index (SVI) for two‑to‑four‑year‑old passenger cars continued its upward trend in April. The metric increased by 11.7% compared with March, while demand was 12.2% higher year on year.

‘This underlined a clear improvement compared to early 2025 and confirms that market momentum has only strengthened,’ said Robert Madas, regional head of valuations.

Supply conditions eased slightly. The AMVI fell by 1% month on month. Nevertheless, stock levels remained 1.2% higher than a year earlier. This indicates that supply remains broadly balanced and above last year’s level despite the marginal monthly contraction.

Turnover speed improved again in April. The average time needed to sell a used car declined to 66.5 days, a month-on-month improvement of two days. Compared with April 2025, however, turnaround times were 1.7 days longer.

Full hybrids (HEVs) took the lead in turnover speed at 53.1 days, marking a significant improvement compared to March. The Toyota Yaris was a major motivating factor behind this trend. Then came diesel models, needing 63 days to sell on average.

This was followed by battery-electric vehicles (BEVs) at 67.7 days, after a significant improvement compared with March. Next were petrol cars, taking an average of 68.5 days to sell, and plug-in hybrids (PHEVs) at 73.1 days.

Softer pricing dynamics

Pricing dynamics softened in April. The average absolute trade RV of 36‑month‑old cars at 60,000km declined to €22,623. This was down 1.8% month on month but was still 5.4% higher than in April 2025.

Meanwhile, %RVs fell to 46.9% in Austria. This was down 0.4pp on March and 0.7pp on April last year, highlighting renewed pressure on value retention. List prices also edged lower, averaging €48,278 in April. This represented a 0.9% month‑on‑month decline, though prices remained 7.1% higher than a year earlier.

HEVs retained the highest %RV at 51.1%, followed by petrol cars at 49.6%. Then came diesel models with 46.9% and PHEVs with 44.2%. BEVs held the lowest %RV once again, at 38.5%.

Austria’s RV outlook remains broadly unchanged. %RVs are forecast to decline gradually over the coming years as supply normalises further. In December 2026, a 0.5% year-on-year decline is forecast. A 0.7% decrease in 2027 is expected to follow.

Value stability in France

RVs were stable in France during April, maintaining the levels recorded at the end of 2025. A slightly more expensive basket contributed to lower trade %RVs. The average number of days needed to sell a 24-to-48-month-old car was stable overall as well.

Values of petrol-powered models followed the general market trend. The fuel type has seen mostly stable RVs, even as other powertrains experienced larger decreases. Additionally, petrol cars are still widely offered by many manufacturers while diesel cars are becoming rarer.

‘After seeing values fall marginally in previous months, diesel-powered cars saw RVs pick up slightly in April. The fuel type is still in demand on the French used-car market, even as new sales fall,’ commented Ludovic Percier, senior RV analyst for France.

HEVs saw absolute trade RVs remain stable in April. More manufacturers are now featuring the technology in their model lineups. There are increased numbers of these powertrains in the used-car market, with most new entrants coming from mainstream brands.

Toyota has consistently led the French used HEV market, with model reliability boosting RVs. Overall, used HEVs are still in demand in France, but carmakers cannot risk increasing their price premiums. This would jeopardise the value retention of these models.

Supply and demand imbalance

PHEV values kept falling in April as supply and demand on the used-car market remained imbalanced. Previously, new PHEVs with high list prices were sold to fleets on the back of fiscal advantages. This continues to negatively impact the value retention of these used models as they come back to market. Vehicles offering an electric-only range of below 60km have been most affected.

PHEVs were the second slowest-selling powertrain in April, taking 69.1 days on average. This increased compared to March, as more models came back from leasing with smaller electric ranges than newer models.

BEV values were stable. The technology is evolving quickly, with driving ranges extending compared to models from three years ago.

On average, BEVs spent 80.3 days in stock during April, compared with the market average of 66.6. The powertrain retained 35.6% of its new car list price after 36 months and 60,000km. This was compared to the overall market’s 50.2%.

France’s social leasing programme is not helping used-car sales, as buyers opt for new models instead of pre-owned ones. The upper segment will be more impacted in the future as company and fleet vehicle users benefit from fiscal advantages. These vehicles will come to the used-car market in early 2028.

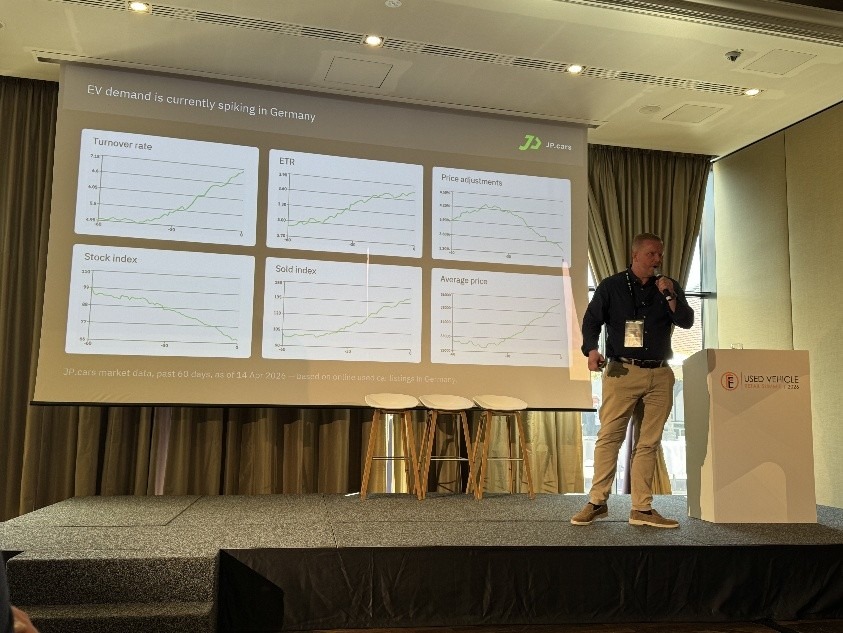
Market liquidity improves in Germany

Used‑car demand in Germany continued to improve in April, building on the recovery seen in the first quarter.

The SVI increased by 9.7% compared with March. However, the demand metric remained below last year’s level, with the index 5.5% lower year on year. This indicates that underlying market activity has not yet fully returned to 2025 levels.

‘Supply conditions strengthened further,’ explained Madas. ‘The AMVI was up by 2.9% month on month. Compared to April last year, stock availability was 28.6% higher, confirming a pronounced rebuild in supply and continued market normalisation.’

Market liquidity improved again in April. The average number of days needed to sell a used car fell to 62.7 days. This was an improvement of 1.2 days month on month and 0.9 days year on year. This suggests that turnover conditions are gradually strengthening despite softer year‑on‑year demand.

Looking at powertrain performance, BEVs were again the fastest-selling technology, taking 58.4 days to leave forecourts. Then came PHEVs at 58.9 days. Diesel cars followed at 61 days, while petrol-powered cars took 66.1 days to sell. HEVs sold the slowest, at 67.3 days.

Supply expected to normalise

RVs remained under pressure. After 36 months and 60,000km, %RVs fell to 46.3%. This was down 0.2pp month on month and 1.3pp year on year. Absolute trade RVs also decreased to €21,319, down 0.9% month on month, but still 0.4% higher year on year.

Meanwhile, list prices softened slightly, averaging €46,093 in April. This represented a 0.5% month‑on‑month decline. However, prices remained 3.3% higher than a year earlier, continuing to support absolute used‑car values despite falling retention rates.

Looking ahead, gradual downward pressure on %RVs is still expected as supply normalises further. By the end of 2026, %RVs are projected to decline by 1.6% compared with December 2025.

Pressure is predicted to ease somewhat in 2027, with a smaller decline of 0.9% expected. This indicates ongoing RV strain, driven by recovering supply, normalising demand, and elevated list prices.

Italy sees seasonal pattern

‘Used car RVs fell in Italy during April. %RVs reached 44.6%, down 0.4pp compared with March. This reflected a seasonal pattern that was broadly in line with expectations,’ highlighted Marco Pasquetti, cluster head of forecasting for Spain and Italy.

Compared with April 2025, %RVs were down by 3.8pp. This was stable on March’s Monthly Market Update, where values also dropped by 3.8pp year on year to 45%.

Average days‑to‑sell for used cars reached 55.4 days, improving by 3.4 days compared with March. However, turnover remained marginally slower than a year ago, with an increase of 1.1 days. Apart from the Dacia Sandero, four of the five fastest‑selling models came from Toyota. Each averaged around 30 days on market.

An analysis of listings across online marketplaces points to a phase of relative stabilisation. The SVI did continue to edge lower. However, the 1.5% month-on-month contraction remains limited and does not indicate a material deterioration in underlying demand.

Encouraging signals emerged from electric powertrains. For the first time since values began declining in 2024, the pace of depreciation slowed for PHEVs and BEVs.

%RVs of all-electric cars slid by 0.1pp compared with March, while PHEVs fell by just 0.2pp. This compares with a market average drop of 0.4pp. In contrast, LPG was the weakest performer, recording the sharpest decline at 0.6pp.

Spain sees EV interest

Spain’s new-car market continues to grow at a steady pace despite the ongoing global situation. Specifically, sales in March rose by 11.7% compared with March 2025, and year-to-date growth stands at 7.6%.

Electric vehicles (EVs), covering BEVs and PHEVs, powered this growth. The powertrain grouping saw registrations increase 62.2% year on year. This meant EVs accounted for roughly a fifth of the new-car market in the first quarter.

More competitive pricing and the incentives offered by the country’s Auto+ Scheme have helped spur this increasing interest in EVs. Rising fuel prices and improvements to infrastructure have also helped to shrink the barriers to demand.

This growing interest in electrification is also evident in the used-car market. Transactions of used PHEVs grew by 51.3% while BEVs saw an increase of 48.8% in the first quarter. However, EVs still only accounted for 4.2% of Spain’s used-car market in the period.

More affordable models

‘This demand is not clearly reflected in the average EV transaction price,’ explained Ana Azofra, regional head of valuations and insights. ‘The mix of used cars on offer now features a greater proportion of entry-level models. There are also more models from Chinese brands with highly competitive pricing strategies.’

PHEVs remained virtually unchanged at €28,329 for a three-year-old car at 60,000km. Meanwhile, BEVs experienced a slight drop compared with March, down to €24,379.

Petrol cars saw their RVs rise by 0.8% compared with the previous month, while diesel car values fell by 0.2%. In contrast, HEVs showed no signs of slowing down and led the way once again with a 1.2% increase in their average transaction value. Unsurprisingly, the powertrain also occupied several places in the fastest-selling models ranking.

The Dacia Sandero took first with an average turnover of 42.4 days, compared with the market average of 74.3. The Sandero was followed by the Toyota Yaris Cross and the Cupra Formentor.

Positive market trend in Switzerland

Following a recovery in February and March, used‑car demand in Switzerland continued to improve in April. The SVI rose by 3.3% month on month. Demand was 2.1% higher compared to April 2025, confirming a gradual but sustained recovery following weakness in January.

Supply conditions eased slightly. The AMVI declined by 1% compared with March. However, the index was up 4% year on year. This indicates that stock availability exceeded last year’s level despite the recent monthly dip.

%RVs continued to decline in April. The average %RV for a 36-month-old car at 60,000km dropped to 41.3%. This marked a month-on-month decline of 0.2pp and a sharper year-on-year drop of 2.4pp. This highlights persistent depreciation pressure in the Swiss used‑car market amid elevated supply and rising prices.

HEVs retained the most value of any powertrain in April at 46.2%. Then came petrol-powered cars at 42.6%, diesel-powered models at 40.9% and PHEVs at 39.2%. BEVs continued to be the worst-performing powertrain, holding only 35.6% of their original list price.

Absolute trade RVs decreased slightly to CHF 26,543 (€28,940), down 0.6% month on month, but remained 2% higher year on year. List prices edged lower, averaging CHF 64,192, a 0.2% month‑on‑month decline, while remaining 7.8% higher than a year earlier.

Used-car market speeds up

‘Market liquidity improved noticeably in April,’ revealed Madas. ‘The average time needed to sell a used car dropped to 73.3 days, representing a 3.1‑day improvement month on month and a 1.2-day improvement year on year.’

HEVs sold fastest at 56.7 days, followed by BEVs at 68.3 days and by petrol cars at 71.4 days. This was followed by diesel cars at 79 days. PHEVs took the longest to leave forecourts at 88 days.

Looking ahead, %RVs are forecast to decrease further in the coming years, but at a slower pace. By the end of 2026, %RVs are expected to fall by 1.5% compared to December 2025. A further 0.5% drop is anticipated in 2027.

Demand improves in UK

The April 2026 Monthly Market Dashboard showed that demand improved in the UK’s used-car market. This was even as %RVs softened across most fuel types.

Month on month, the average %RV of a three-year-old car at 60,000km slipped by one percentage point to 47.4%. However, compared to 12 months earlier, it was 3.4pp lower.

Value retention performance weakened across most fuel types in April. BEV %RVs fell to 34.6%, down 1.7pp compared to March. PHEV values declined by 1pp to 44.5%. Petrol values eased by 1.2pp to 48.7%, and HEVs also dropped 1.2pp to 51.7%. Diesel values strengthened, rising 1pp to 58.3%.

Market-wide retail activity strengthened with the SVI indicating that transactions increased by 6.3% compared to March. The AMVI confirmed a 10.6% month-on-month increase in the volume of cars advertised on dealer forecourts.

The UK’s new-car market often sees delivery spikes in March and September, as new registration plates are released. This can affect supply into the used-car market as buyers wait for their new-plated vehicles.

‘This increased level of stock likely resulted from March’s plate-change,’ commented Jayson Whittington, regional head of valuations for the UK. ‘Nevertheless, the time it took dealers to sell a used car improved, dropping to 32.8 days on average. This marked a reduction of 5.6 days compared to March.’

Average days to sell varied notably by fuel type. Petrol and HEVs were the fastest movers, taking 31.4 and 31.7 days respectively, reflecting strong consumer demand. BEVs followed at 34.8 days, indicating steady turnover. PHEVs took longer to sell at 38 days, although they still experienced a 2.4-day improvement compared to March. Diesel vehicles took the longest amount of time to sell, averaging 40.3 days.

What happened to passenger car and light-commercial vehicle (LCV) registrations in the EU during the first quarter of 2026? Which brands proved most popular? Tom Geggus, Autovista24 editor, reveals all in the Automotive Update podcast.

In this episode, an exploration of the latest ACEA data covering registrations of different powertrains and brands in the EU. Spanning the first quarter of 2026, Autovista24 zeroed in on volumes of new passenger cars and LCVs. Also, a look at the UK’s ageing car parc, plus an overview of which brands are seeking to set up shop in the EU. 

Subscribe to the Autovista24 podcast and listen to previous episodes on SpotifyApple and Amazon Music.

EU new-car market springs forward

According to ACEA, registrations of new passenger cars increased across the EU by 4% in the first quarter of 2026. Amid a strong March, electric vehicle (EV) growth was fostered by various incentives, purchase schemes, and tax benefits.

During the first quarter, combined battery-electric vehicle (BEV) and plug-in hybrid (PHEV) registrations increased by 31.5% year on year.

Hybrids, including full and mild versions, remained the EU’s preferred new-car powertrain. Combined, hybrids, BEVs and PHEVs accounted for over two-thirds of the total EU new-car market between January and March.

Meanwhile, deliveries of internal-combustion engine (ICE) vehicles, including petrol and diesel models, fell by 17.6% year on year.

EV adoption boosts new EU LCV growth

In the EU’s new LCV market, diesel deliveries dropped by 0.8% in the first quarter of 2026, ACEA data revealed. Despite this, with a dominant 288,484 units, diesel made up 80% of all LCV registrations up to 3.5 tonnes.  

Although diesel power remains the backbone of the EU’s new-LCV market, demand for electrified models has grown. Combined deliveries of new BEVs and PHEVs increased by 42%.

Additionally, hybrid vehicle registrations rose by 42.1%. This gave EVs a 12% share of the EU’s new LCV market, and hybrids a 3.5% slice.

EU’s leading automotive brands in 2026

Volkswagen (VW) recorded the largest unit volume of any singular brand in the EU across the first quarter of 2026. It took a 10.4% share of the EU passenger car market. However, this was down from 11.2% compared to the same point last year.

Skoda claimed the second largest market share at 6.8%, up from 6% in the first quarter of 2025. Meanwhile, Fiat gained a 0.8 percentage point (pp) increase in market share, to 3.5%.

BYD saw a significant 1.1pp increase in market share to 1.8%. It also recorded the largest growth in registrations in the first quarter, up 169.7% year on year.

Notably, around 120,000 first-quarter registrations were not tied to a specific brand. This likely reflects registrations from newer entrants, such as Xpeng, Omoda, and Jaecoo. These marques have made a strong showing in the EU recently. Overall, this group grew sales by 65.3% year-on-year, raising its market share from 2.7% to 4.3%.

Latest UK car parc make up

Vehicle volumes on the UK’s roads reached a record 42.5 million units last year, according to the SMMT. This marked a 1.4% increase, compared with 2024. There were nearly 36.7 million passenger cars, up by 1.4%, a fourth consecutive year of growth.

Fleet renewal continues to push electrification, with roughly one in 22 vehicles emitting zero emissions. In another new record, almost 1.8 million BEV passenger cars were in use, up 34.7% year on year.

UK drivers are holding on to their cars for longer amid cost-of-living pressures. The average age of cars on the country’s roads was 9.7 years in 2025, up from 9.5 in 2024.

European home for Chinese OEMs?

Several Chinese carmakers are reportedly seeking locations to manufacture vehicles in Europe. According to Reuters, Hongqi is in talks with Stellantis to use its plants in Spain to build its models. 

Meanwhile, Bloomberg reported that Dongfeng representatives have visited Stellantis plants in Spain, France, Italy and Germany. SAIC-owned MG is considering a production location in Spain, Bloomberg also revealed.

Producing models within the EU could help companies like these navigate the bloc’s import tariffs. Use of existing infrastructure could also lower manufacturing costs. 

The EU’s new light-commercial vehicle (LCV) market managed modest growth in the first quarter of 2026. This was boosted by an increase in electric vehicle (EV) demand, as diesel’s dominant grip weakened. Tom Hooker, Autovista24 journalist, unpacks the data.

New LCV registrations in the EU grew by 2.3% year on year in the first quarter of 2026. According to ACEA, a total of 360,648 new LCVs took to the EU’s roads. This signalled a rebound for the sector after an 8.8% delivery decline in 2025.

This growth was enabled by surging registrations of new EVs, including battery-electric and plug-in hybrid technologies. Hybrid LCVs, made up of full and mild-hybrids, also saw strong delivery improvements. This came as diesel volumes stagnated.

Shifting LCV powertrain shares

After a 12.8% slump in registrations during 2025, diesel’s first-quarter result in 2026 could be seen as positive.

Deliveries dipped by 0.8% in the first quarter of this year, with 288,484 units ensuring a dominant 80% market share. However, this was down 2.5 percentage points (pp) year on year, and a 0.7pp drop from its overall 2025 share.

Meanwhile, petrol represented 3.7% of overall volumes. This was down from the fuel type’s 5.2% hold during the first quarter of 2025. Deliveries slumped by 27.1% year on year, with 13,267 new models taking to EU roads.

Combining diesel and petrol volumes, internal-combustion engine sales continued to control the LCV market. This was despite a 2.3% decline in deliveries, plus a 4pp drop in share to 83.7% during the first quarter.

Electrified LCV momentum

EV registrations soared by 42% in the first quarter, reaching 43,441 units. Without this result, the EU’s new LCV market would have fallen by 1.4% year on year between January and March. The powertrain group accounted for 12% of total deliveries, up from 8.7% in the first quarter of 2025.

Hybrid volumes enjoyed a similar year-on-year increase of 42.1%. Yet this was based on a lower figure of 12,636 units. Hybrid-powered LCVs represented 3.5% of all LCV registrations, up 1pp compared to one year prior and just 0.2pp behind petrol.

Adding hybrid deliveries to the EV total, the electrified LCV market saw deliveries increase by 42%. This meant the grouping took a 15.5% market share, up from 11.2% during the first quarter of 2025.

Diverging national LCV results

Across the EU’s 27 member states, LCV registrations saw varying results in the first quarter. In total,18 markets enjoyed growth, including France, the biggest new LCV market between January and March. The country posted a 3.7% year-on-year increase to 88,609 units. This result contrasted with its new-car market decline.

Furthermore, 12 markets achieved double-digit improvements, such as Spain, which recorded the third-highest number of new LCV deliveries. Volumes surged by 13% year on year in the country, with 48,176 units delivered. This proved even more impressive than its new-car market growth during the same period. Poland also achieved a strong result, with a 11.2% increase to 18,113 registrations.

Many four-digit markets also saw notable performances. This included 34.7% growth in Greece. Slovenia, Ireland and Sweden enjoyed improvements of 19.4%, 17.5% and 15.4%, respectively. New LCV sales rose by 15% in Luxembourg, 13.3% in Czechia, and 12.4% in Austria.

Conversely, nine countries suffered delivery declines, such as Germany, the EU’s second biggest new LCV market. Volumes fell by 9% year on year to 57,886 units. This came as Germany’s new-car market enjoyed a strong start to the year.

Additionally, LCV registrations dropped by 1.7% to 46,883 units in Italy, the bloc’s fourth biggest LCV market. Meanwhile, its new-car market recorded growth of 9.2% in the first quarter.

Even steeper declines were recorded in Finland and the Netherlands. The two countries saw double-digit drops of 15.5% and 12.5%, respectively. Hungary also endured a 10% slump year on year.

Price differences between European used-car markets are creating cross-border sales opportunities for dealers, especially for electric vehicles (EVs). However, after identifying these opportunities, utilising them efficiently and at scale can present a challenge. Tom Hooker, Autovista24 journalist, explores the topic at this year’s Used Vehicle Retail Summit.

Different European used-car markets can see varied metrics in terms of pricing, stock days and residual values (RVs). This regional difference also applies to EV demand, which is seeing variable adoption rates across the continent.

For example, the average trade RV of 36-month-old battery-electric vehicles (BEVs) at 60,000km diverged between neighbouring countries in March. According to Autovista24’s Monthly Market Update, this value sat at €16,371 in France, while in Spain, BEV RVs stood at €24,553.

The average number of days needed to sell a two-to-four-year-old BEV also experienced contrasting results across Europe in the month. The turnover rate was 84.2 days in France, compared to an average of 58.8 days in Germany.

In this context, cross-border remarketing can unlock potentially untapped value. It allows sellers to capitalise on locations where EV demand is greater, prices are higher, and stock days are lower. It also presents an opportunity to move models away from a market experiencing stagnating demand or oversupply.

Cross-border opportunities

‘Supply and demand levels in every single market are continuously evolving and changing. It is simply impossible to manually monitor supply and demand for each market continuously. You need technology,’ outlined Jan-Willem Seeder, founder and CEO of JP.Cars, in his presentation.

‘If you are not using technology, you are always reacting to the market. The concept of supply, demand and marketability is not so complex. The complexity is seeing and monitoring it in real time,’ he noted. Continuously evolving supply and demand can cause different outcomes in each country, even for the same model.

Seeder stated that in Germany, all the signals clearly show that [EV] demand significantly outpaced supply. Turnover rates increased, stock indexes dropped, selling indexes rose significantly, and prices went up as well,’ stated Seeder.

Jan-Willem Seeder, founder and CEO of JP.Cars, presenting at the Used Vehicle Retail Summit 2026 in Frankfurt, Germany.
Jan Willem Seeder, founder and CEO of JP.Cars.

‘If you must buy a BEV in Germany, given these signals, I can imagine it is a very tight market today,’ he said. ‘The question might be, where can I source these cars? Maybe there are markets with other supply and demand ratios across Europe where you could potentially buy similar cars.’

He recognised that there are markets in Europe where supply and demand ratios are different from those in Germany. There could be buying opportunities in numerous markets where buyers could source vehicles.

‘If you have purchased cars for 100 years from a single source in Germany, and that source is providing you with EVs, you will have a very hard time. The market is not local anymore; the market is international,’ he commented.

Optimising cross-border adverts

Rolf Westgeest, founder of Eurostocks, focused on how cross-border transactions operate on classified marketplace portals. These online platforms allow buyers to search listings and contact sellers directly, rather than purchasing through the platform.

‘There are two things in cross-border trade you can do as a car dealer or retailer. You can go on the auction side with lower prices and fast sales. Or you can go to the classified marketplace portals. It is a higher price, but it could be slower sales of 30 days, 90 days or one year.’

So, if dealers want to benefit from these higher prices, they will need to navigate potentially slower sales. Westgeest highlighted multiple areas where dealers can improve.

 Rolf Westgeest, founder of Eurostocks, presenting at the Used Vehicle Retail Summit 2026 in Frankfurt, Germany.
From left to right: Rolf Westgeest, founder of Eurostocks. Michel van Roon, founder and co-owner of Novatrade24.

Westgeest explained that having adverts appear at the top of search queries can help tackle delays. Photo quality and selection can make a big difference in achieving a high search ranking. The number of reviews under a dealer’s profile is also important. Using analytics provided by the portals can help optimise every advert, too. Despite all this, lead response times can often be the deciding factor.

‘After one hour, 50% of the leads are lost because they are already in a conversation with somebody else. In these portals, people send multiple emails to different dealerships selling the same cars. The first one to respond can make the appointment and win the sale,’ Westgeest told the audience.

Overall, Westgeest highlighted that cross-border sales do not need to be difficult, especially when using marketplace portals. Dealers will see the best results if they choose the right cars, tools, and strategies for online advertising.

Cross-border risks

Alongside benefits, cross-border used-vehicle sales can also come with some legal risks. This can include unintentional participation in value-added tax (VAT) fraud schemes or money laundering ploys. Michel van Roon, founder and co-owner of Novatrade24, explained that this possibility has caused dealerships to hold back.

‘By not participating [in cross-border sales] dealerships leave money on the table, because they are afraid of getting trapped into these schemes. If you want to step into that game, you need to know the rules. You must keep in mind that the tax authorities will have one question. Did you know or could you have known that your buyer was a criminal?’ outlined van Roon.

Michel van Roon, founder and co-owner of Novatrade24, presenting at the Used Vehicle Retail Summit 2026 in Frankfurt, Germany.
From left to right: Michel van Roon, founder and co-owner of Novatrade24. Rolf Westgeest, founder of Eurostocks.

Van Roon then outlined the evidence dealers must provide to apply the 0% VAT rate when exporting vehicles. The information and research required is extensive. He also noted that the person responsible for this in a dealership is usually a salesperson.

‘If you look at how much time you take in getting leads, a salesperson should not chase documents. They should chase leads. That is their job. So, if you look at this cross-border trade process, it is full of friction,’ he commented.

Is cooperation the key?

Van Roon suggested that dealerships in the automotive industry cooperate on this issue. To solve it, digital platforms can be used to simplify cross-border vehicle trading.

These platforms manage the legal, administrative, and transaction processes between buyers and sellers in different countries. This can make dealers more confident when participating in cross-border sales. It can also increase trust between dealers, tax authorities and banks.

‘Cross-border compliance does not need to hold you back from doing the trades you need to do to get the best results. But beware of the consequences and requirements,’ warned van Roon.

Together, these sessions highlighted a clear opportunity in the European used-car market. Price fragmentation, especially among EVs, is creating significant opportunity for sellers. However, only those with the right tools and processes to act across borders stand to benefit.

Robust demand pushed the EU new-car market to year-on-year growth in the first quarter of 2026. Rising electric vehicle (EV) sales prevailed as a significant catalyst for growth. But is a familiar powertrain still dominating sales? James Roberts, Autovista24 web editor, unpicks the latest data.

In March, 1,158,317 new vehicles were registered across the EU, according to Autovista24 calculations of ACEA data. This equated to a 12.5% year-on-year lift. Overall, in March, 24 of the 27 EU states recorded new-car market growth.

Assessing the first quarter of 2026, this strong March performance helped boost the EU’s overall new-car market. After three months of the year, 2,822,617 new vehicles reached EU customers according to Autovista24 analysis of ACEA data. This ensured a healthy 4% raise, amounting to an additional 107,912 units.

Electric sales increase

Sales of EVs, spanning battery-electric vehicles (BEVs) and plug-in-hybrid vehicles (PHEVs), continued to increase in the first quarter. The EU’s four biggest markets, Germany, Italy, France, and Spain, all saw double-digit BEV volume increases in the month.

This figure has been helped by domestic tax benefits and incentive schemes. However, some countries have seen consumer sentiment turn towards electrification, particularly as petrol and diesel prices increased.

Hybrid powertrains, including both mild and full-hybrid versions, also made gains. Consistently the preferred choice for EU consumers, the powertrain made it over the one-million-unit mark in the first quarter. Despite this high watermark, a peak to hybrid demand could be in the rear-view mirror.

New petrol vehicles are helping keep the share of internal-combustion engine (ICE) cars above EVs. This gap is narrowing, but is it closing fast enough to satisfy EU goals to phase out new petrol and diesel sales by 2030?

Hybrids hold the cards

The best-selling powertrain choice for new cars across the EU was hybrids. March saw 444,835 models featuring the technology roll off the bloc’s forecourts. This equated to a 20.1% volume increase and a 38.4% slice of the new-car market, up 2.4 percentage points (pp).

Over the first three months of 2026, hybrid volumes increased by 12.8% year on year, with 1,089,421 units accounted for. This underscored a consistently high EU new-car market share of 38.6%, up 3pp.

In the first quarter, hybrid registrations increased in 20 of the 27 EU states. Despite eye-catching EV sales growth, the larger markets saw hybrid volumes stay high. After three months of the year, these volumes outweighed both BEV and PHEV figures.

Hybrid sales in Italy and Spain scored double-digit increases at 25.8% and 18.5%, respectively. Meanwhile, Germany saw an upswing of 7.4%, and France a modest gain of 3.1%.

Other markets scored notable year-on-year hybrid gains in the first quarter. This included Austria with 30.2%, Czechia 14.5%, and Portugal 44.9%

Bulgaria witnessed the highest hybrid percentage gain of 114.2% with 647 units registered. Estonia also saw triple-digit gains amounting to 109.3% and 2,286 units.

EU EV sales on the right track?

Three months into 2026, total EV sales, combining BEV and PHEV volumes, reached 815,281 units in the EU. This marked a 195,466-unit boost, equating to a 31.5% year-on-year increase. This cumulative gain carved out a 28.9% market share, up 6.1pp.

BEVs made up the majority of EV registrations, with 546,937 all-electric cars making their way to EU customers. This 32.5% increase in volumes ensured a 19.4% market share, up 4.2pp.

Germany enjoyed a year-on-year BEV registrations increase of 41.3% in the first three months of 2026. March helped with the country recording its biggest BEV registration increase and market share since August 2023.

Despite ending the first quarter with an overall new-car market drop of 2.1%, France saw a positive BEV result. It was second only to Germany in terms of unit volumes, with 112,083 units delivered. Buoyed by Subsidies, income-based schemes, and company-car tax changes, this trend has helped stabilise the market.

Spain’s new-car market impressed in 2025, but EV incentives are being ironed out for this year. However, between January and March, BEV volumes still increased by 41.6%. This is compared with early 2025, which saw inflated market results spurred by aid packages for flood-hit regions.

PHEVs helping electrify EU markets

Alongside BEV improvements, PHEV registrations continued to grow. In total, 268,344 PHEVs made their way to EU customers between January and March. This marked a 29.7% uptick, securing a 9.5% new-car market share, an increase of 1.9pp year on year.

PHEV demand allowed Italy to return strong EV results in the three-month period. While BEV volumes improved by 65.7%, PHEV sales climbed to 40,052, a 110.1% surge. While petrol and diesel deliveries fell in the country, EVs and hybrids enabled market-wide growth of 9.2%.

Austria witnessed healthy BEV uptake in the first quarter, with a 22.4% volume increase. Coupled with a 45.6% rise in PHEV sales, this pushed the country’s new-car market to a gain of 17%.

Similarly, Poland continued to impress. PHEV power proved irresistible in the EU’s fifth-largest market. In the first three months of the year, the powertrain’s volumes increased by 10.5%, with 11,684 taking to Polish roads. Almost half of these units were registered in March.

Balkan boost

The most eye-catching EV sales bounce occurred in Croatia. The Balkan nation enjoyed a 282.4% increase in all-electric registrations to 780 units. This has seemingly been achieved with the help of an incentive scheme. Additionally, year-on-year PHEV registrations increased by 145.8%, leaping to 1,094 deliveries between January and March this year.

Slovenia also saw a significant turn towards plug-in powertrains. BEV volumes increased 78.2% year on year, with 2,297 sales, while PHEV volumes rose 44.5% to 734 units. The country also saw healthy hybrid increases of 18.5% as well as a marginal petrol registration growth of 1.8%.

As the EU new-car market enters the fourth month of the year, one pattern is emerging. EVs are playing a significant part in bolstering EU members’ new-car market fortunes, large and small.

Adding hybrid volumes to BEV and PHEV sales across the bloc saw a total of 1,904,702 new vehicles sold between January and March. This ensured a dominant market share of 67.5%, a year-on-year gain of 9.1pp.

Petrol remains a choice amid EU electrification

Three months into 2026, the EU recorded 636,502 new petrol car registrations. While this marked an 18.2% year-on-year slide, it equated to a 22.6% market share, the second largest after hybrids. Significantly, petrol sales also exceeded BEV and PHEV figures.

In total, just five EU nations witnessed petrol registration improvements. The highest came in Estonia, with a 106.3% year-on-year climb. Austria saw a 4.3% improvement. This was boosted by a strong March, where 8,181 new petrol variants were registered in the country.

In the larger markets, falling petrol sales proved prevalent in the first quarter. France saw the biggest drop at 40.3%, then Italy at 18.6%, followed by Spain at 18.1%, and Germany at 16.1%.

Combined petrol and diesel units topped out at 855,067 across the EU in the first three months of 2026. This gave new ICE registrations a 30.3% hold over the market, down 7.9pp year-on-year, but still 1.4pp ahead of the EV market share.

While petrol still provides a relatively popular mainstream new-car choice, diesel continues to decline. Between January and March, 218,565 new vehicles made their way to customers, down 15.7%, returning a 7.7% market share, falling 1.8pp year on year. Just four nations recorded growth for the fuel type.

The EU’s leading automotive brands and manufacturer groups performed strongly in March. But how is the rise of new entrants to the market diluting the shares of established carmakers? Autovista24 special content editor Phil Curry examines the figures.

The EU’s new-car market is starting to find its footing following a difficult start to the year. But as some established brands returned to growth in March, the volume from new entrants jumped considerably.

The latest ACEA data reveals a market still dominated by traditional names, while also seeing volumes shared across more manufacturers. But which brands came out on top in March?

VW returns to growth

Volkswagen (VW) remained the EU’s best-selling brand in the month. The German carmaker secured 115,612 registrations in the month, giving it a 10% market share. The performance meant registrations increased by 2.2% year on year, the marque’s first improvement of 2026.

While VW’s share of the EU total was commanding, it was also one percentage point (pp) down on March 2025. This symbolised the increasing competition in the bloc’s automotive market.

Group stablemate Skoda kept its position as second-best-selling brand in March, thanks to 75,104 registrations. The carmaker has been the most consistent performer of the VW Group marques across the first quarter. It was the only one to see growth in each month.

March represented its best volume of 2026, with a 21.2% increase year on year. This was enough for a 6.5% hold of the EU market.

Renault had its strongest period of the year in terms of volumes. With 72,193 units, the 3.6% increase during March 2025 saw it jump to third. The carmaker secured 6.2% of the market, although this was a drop of 0.6pp.

Toyota was the fourth-best-selling brand in the month, thanks to 70,638 deliveries. Volumes increased by 6.7% compared to the same point 12 months prior, while its 6.1% market share was down 0.3pp.

Ending the month in fifth was BMW. The carmaker saw 67,102 deliveries in the month, an increase of 18.5%. This meant its market share increased, albeit by just 0.3pp, to 5.8%.

A rise and fall market

In total, 25 of the EU’s major brands saw volumes increase year on year. However, 13 marques suffered registration decreases in March.

Peugeot was the highest-volume brand to record a decline. Despite leading the Stellantis Group in terms of deliveries, its 54,454 units was 10.6% down year on year. This meant its market share fell from 5.9% in March 2025 to 4.7% last month.

Ford also struggled in March, recording its third volume drop of 2026. With 26,029 units, deliveries fell 14.5%. Meanwhile, both Alfa Romeo and Mitsubishi saw drops of 17.2% and 33%, respectively.

BYD saw the greatest year-on-year registration growth. The Chinese brand delivered 21,158 units to customers across the EU, a 155.2% increase in volumes. This was enough for a 1.8% market share, up 1pp. It ended March as the 21st best-selling brand in the EU.

Tesla also saw a jump in fortunes. In total, the carmaker recorded 36,868 deliveries, a rise of 101.9%. With a 3.2% market share, up 1.4pp, it placed 13th in the month.

New entrants making gains

The latest ACEA data covers the results of 38 carmakers, with some smaller-volume brands grouped together. However, according to Autovista24 analysis, there were 50,337 registrations in March that were not attributed to brands in the available data.

This grouping likely includes marques such as Xpeng, Omoda and Jaecoo, as well as other new brands to the EU. These brands had a strong presence in the European electric vehicle (EV) market during February, according to the latest data from EV Volumes.

This category is steadily increasing. Non-attributed registrations increased by 209.3% in March, based on Autovista24 calculations. This gave the grouping a 4.3% share of the market, up from just 1.6% a year prior.

After three months of 2026, this grouping saw an increase of 65.3%, with 119,999 units delivered to EU customers. This was enough for 4.3% of the market, a rise of 1.6pp.

With more brands entering the EU market, the increased competition is diluting the shares of more established carmakers. While many saw year-on-year increases in volumes, their market shares fell. As the popularity of these new entrants rises, increasing choice for buyers, it is likely that more share dilution will occur.

Strong results in first quarter

Across the first quarter of the year, VW was the leading brand in the EU, with 292,231 deliveries. However, this was a drop of 3.5% year-on-year. Yet the carmaker’s market share was 10.4%, down by 0.8pp, but still 3.6pp ahead of its nearest competitor.

Jumping into second after its strong performance in March was Skoda. With 191,657 units, it saw volumes jump 16.9% in the first quarter. The carmaker overtook Toyota, which dropped third with 188,140 deliveries in the three-month period.

Once again, BYD saw the greatest registration increase. Across the first three months of 2026, its EU volumes improved by 169.7%, as the Chinese carmaker found its stride. As it did in March, BYD took 1.8% of the market.

It was followed by Tesla, which took second in terms of growth thanks to its strong March performance. Its volumes increased by 59.6% compared with the same period last year, as 57,792 units were delivered. The US brand therefore took a 2% share of the total EU market in the month.

Ford’s struggles continued in the first quarter. Deliveries were down by 18.9%, as 67,068 units were registered. Dacia also posted a decline in the period, as its 115,418-unit tally was 18.7% down year on year.

VW Group dominates in March

Thanks to the performance of VW, Skoda and Audi, VW Group was the dominant manufacturing group in March. With 296,431 registrations, it saw volumes rise by 7.8%. It held 25.6% of the market in the month, although with increasing competition, this dropped by 1.1pp.

The result was not helped by declines for the Cupra, SEAT and Porsche brands. However, the Group’s top three marques made up 82.9% of the German carmaker’s total, powering it to an improvement.

Despite counting more brands under its umbrella, Stellantis was still some way off the top spot. Its 184,842-unit tally was up 6.8% compared to March 2025, while its 16% market share was down 0.8pp.

The group’s volumes were not helped by the poor result for Peugeot, which made up 29.5% of Stellantis’ total deliveries in the month. This was slightly countered by Fiat, including Abarth, which saw volumes increase 26.7%, in another strong performance for the Italian marque. Citroën also helped, with an 18.3% increase, while registrations from Opel improved 22.9%.

Renault Group experienced its first monthly improvement of the year, with registrations up 3.9%. For the first time in 2026, Renault, Dacia and Alpine all posted simultaneous growth. With Renault making up 57.7% of the group’s deliveries, its strong performance in March helped boost overall volumes.

A difficult pattern for some

The manufacturing group results for the first quarter mirrored those of March. VW Group led the way with 745,828 deliveries, up 2.5% compared to the same period of 2025. However, its market share fell by 0.4pp, to 26.4%.

While the VW brand saw a decline, the combined totals of Skoda and Audi, making up 44.1% of the group’s total, were enough to keep the overall delivery volume positive.

Stellantis was the second-biggest volume group after three months of the year, with 489,081 units, up 8.5%. While Peugeot struggled, with a 7.2% drop, Fiat, Citroën and Opel, making up 58% of volumes, were able to aid the group’s growth.

While sitting in third, the rollercoaster results from Renault Group meant that its 286,296 registrations were down 8.4% year on year. Two of its marques saw losses after the first quarter of 2026 was complete, with Renault dropping 0.1%, while Dacia fell 18.7%. Only Alpine registered an increase, of 20.9%, but the brand made up just 0.8% of the group’s volume total.

February continued a strong start to 2026 for battery-electric vehicle (BEV) sales in Australia. New and established carmakers are competing for ground in the country, but which models are leading the way so far? James Roberts, Autovista24 web editor, investigates.

In total, 11,101 new BEVs were sold in Australia during February, according to the latest data from EV Volumes. This was a rise from 5,707 in February 2025, marking a year-on-year increase of 94.5%.

After the first two months of 2026, BEV sales reached 18,656 units, up from 9,577 in the same period of 2025. This meant that BEV numbers increased by 94.8% in Australia.

So far, 2026 has confirmed Australia’s BEV market as a crucible of intensifying competition. In particular, the established fixture of Tesla is facing a challenge to its supremacy with multiple model offerings from BYD. Added to this mix, Geely, along with its Zeekr brand, are disrupting the established all-electric order.

Tesla on top in February

For now, Tesla remains at the top of Australia’s BEV model chart, thanks to a strong performance from its Model Y in February. It captured 25.1% of the overall BEV market, up 8.9 percentage points (pp) compared with 12 months prior.

The venerable BEV saw 2,791 units delivered in the month, ensuring a 202.1% year-on-year volume upswing. This was a record February result for the model, with Tesla often posting more sales during end-of-quarter months.

Taking into account total BEV sales two months of the year, the Model Y led the way with 3,079 units. This was good enough for a 16.5% market share.

In second, BYD’s BEV challenger the Sealion 7 saw 1,327 vehicles reach customers in Australia. A huge 745.2% boost in year-on-year sales affirmed the domestic popularity of the all-electric SUV. This was coupled with a BEV market share of 12%, up 9.2pp year on year.

February marked 12 months of sales for the Sealion 7, recording 15,908 deliveries in that period, according to EV Volumes. This places it as the fourth best-selling BEV overall in Australia.

Combining January and February’s data, the Sealion 7 was hot on the heels of the Model Y. It trailed the US BEV by 581 units, with 2,498 sales and a 13.4% market share.

Changing of the BEV market guard?

The Zeekr 7X rounded out Australia’s BEV top three in February. After six months on the market, the mid-sized SUV saw 628 units leave forecourts in the month. This ensured a 5.7% share. It also held third place after two months of the year, with 1,046 deliveries and a 5.6% market share.

Despite a 27.7% year-on-year volume drop, the Tesla Model 3 secured fourth with 483 units sold. This did mean the US BEV’s market share fell to 4.4%, a year-on-year decline of 7.3pp.

February confirmed the Geely EX5 as a serious player in Australia. The Chinese SUV saw 416-unit sales, putting it fifth. This continued an unbroken streak of triple-digit sales since its launch in March 2025. It carved out a 3.7% BEV market share in the month.

Sixth went to a relative BEV market veteran in the shape of the MG4. Since its launch in August 2023, the compact hatchback has sold 13,719 units. In February it saw a robust 406 deliveries, a respectable result for the model.

However, this performance was overshadowed by increased competition. Amid a 10% year-on-year fall in sales, the MG4 saw its market share slide by 4.2pp.

BYD making wider BEV market waves

On the back of a promising January, a trio of BYD BEVs continued a strong top 10 showing in February. More importantly, the Chinese manufacturer made a considerable impact in the year-to-date table.

After almost three and a half years in the Australian market, the BYD Atto 3 remained popular in the month. This was affirmed by the model taking seventh with 384 units sold, marking a 178.3% year-on-year surge. This helped increase the Chinese BEV’s market share up by 1.1pp to 3.5%.

The BYD Atto 1 secured ninth place. Joining the Australian BEV market in late 2025, this small and affordable EV has hit the ground running. The month returned a second, triple-digit volume, with 349 sales and a 3.1% market share.

Rounding out the top 10 was the BYD Atto 2. This small SUV is emerging as a popular choice for BEV customers in Australia. It is also proving to be a genuine market disruptor. February saw a fourth month on the market, and 347 sales.

However, it is in the year-to-date stakes where this small BEV impresses. Cumulative sales so far this year place the Atto 2 as the fourth best-selling BEV, with 909 units. As Australia’s most affordable SUV, according to RACV, its impressive 4.9% market share will surely grow this year.

Despite not making the February top 10, a consistent performance helped the BYD Seal finished eighth two months into 2026. It gained with 597 sales in that period.

Will Chery be on top in 2026?

February also saw strong showings from Chery-owned brands. In just its second month on the BEV market, the Jaecoo J5 secured eighth with 369 sales and a 3.3% market share.

This strong start was enough to ensure 10th place in the cumulative standings. In total, 584 units made their way to customers across January and February.

Sister brand Omoda also enjoyed a strong start to 2026. The company’s E5 BEV reached 299 sales, placing it 16th with combined January and February volumes.

Total new electric vehicle (EV) sales fell across the world in February. But which markets and models drove this result? Autovista24 editor Tom Geggus explores EV Volumes’ latest data.

Sales of new EVs, including battery-electric vehicles (BEVs) and plug-in hybrids (PHEVs), fell globally in February. Combined, 1,014,980 plug-in units took to the roads, down by 16.5% year on year, according to the latest data from EV Volumes.

Figures for the first two months of the year were cushioned by a less severe 9.5% drop in January. This still equated to a cumulative year-on-year decline of 12.6%, as volumes of EVs reached 2,179,155 units.

Of the two powertrains, PHEV sales saw a greater decline. Including extended-range electric vehicles (EREVs), deliveries fell by 20.6% across the first two months of the year to 715,698 units. In February alone, the powertrain recorded a 22% drop in volumes to 328,243 units. However, PHEVs only accounted for 32.3% of EV sales in the month, with fully-electric cars accounting for over two thirds.

BEV deliveries saw a relatively smaller 13.6% decline. This meant 686,737 newly sold cars featured all-electric technology in February. Across the first two months of 2026, this tallied to 1,463,457 units, down 8.1% year on year.

Regional EV performance

China, as the world’s biggest EV market by volume, led a trend of declines for both powertrains in February. While Chinese New Year fell on 17 February, the sales decreases surpassed a seasonal effect.

EV Volumes confirmed BEVs, PHEVs and fuel-cell EVs were omitted from the country’s strategic five-year development plan for emerging industries. Additionally, EVs are no longer exempt from purchase tax, with a 2026 rate of 5% and 10% from 2027 onwards. The end of the national EV subsidy scheme and suspension of scrappage programmes in several cities also compounded this effect.

Across January and February, China saw deliveries of PHEVS fall by 37.9% year on year. With 54.6% of the technology’s sales occurring in the country, this was a driving factor behind the global decline.

Among the world’s other big PHEV markets, the US also saw a decline, with 51.4% fewer new models leaving forecourts. However, the country only represented 3.5% of the market across January and February. Global figures were helped by strong growth in Germany, the UK and Italy.

Parallel BEV performance

The global BEV market was broadly parallel, with 41.6% of the powertrain’s sales occurring in China. Over the first two months of 2026, deliveries of the technology declined by 29.7% year on year in the country.

The US also struggled with BEV sales in the first two months of the year, with deliveries down by 32.4%. As the second-biggest global market for all-electric technology, this added to the overall decline.

However, the figures were helped by good performances in Europe. Germany and France both posted double-digit improvements, while the UK avoided a drop, according to EV Volumes data.

Tesla Model Y out in front

The Tesla Model Y was the best-selling BEV across the world in February, delivering 68,556 units. This represented a year-on-year increase of 34.8%, as its market share climbed by 3.6 percentage points (pp) to 10%.

The positive result pushed the model’s market share to 8.4% in the first two months of 2026. This gave it a sizeable lead over second place.

February’s chart saw the Tesla Model 3 take second, despite its sales dropping 21.2% to 31,189 units. It accounted for 4.5% of global BEV deliveries, down 0.5pp from February 2025. This put it in third two months into the year, with 47,409 sales equating to a 3.2% market share.

The BYD Seagull, also known as the Dolphin Surf in some markets, finished third in February. Its deliveries dropped by 33.4% to 20,600 units, meaning its market share slid by 0.9pp to 3%. Despite a weak January, the model still held a 2.6% share across the first two months of the year, putting it in fourth.

Thanks to a good domestic result, the Xiaomi YU7 was the fourth-best-selling new BEV across the world in February. It saw 20,131 sales and a 2.9% market share. With a similar strong run in January, the Chinese model sat second in the cumulative chart. Despite being 64,951 units behind first, this was impressive for a model which first recorded deliveries in June 2025.

A more recent arrival, the Li Auto I6 took fifth in February after launching in September last year. Its 15,997 units represented 2.3% of all new BEV sales. It also took fifth across the first two months of 2026 with a slightly smaller share of 2.2%.

Highs and lows

The second half of February’s global BEV table saw the Geely Geome Xingyuan, also known as the EX2, come sixth. However, its 13,596 sales were down 52.4% year on year. This meant its market share slipped from 3.6% to 2%. The model took a 2.1% share in the cumulative results with 30,038 sales.

The Nio ES8, also known as the EL8, took seventh in February. Its deliveries climbed by 2321.7% to 11,818 units. It accounted for 1.7% of all BEV sales, up 1.6pp. This put it ahead of the Geely Geome Xingyuan between January and February, with 30,374 units moved and a 2.1% market share.

In the monthly results, the Toyota bZ4X was eighth with its sales rising by 154.1% to 11,203 units. It claimed a 1.6% share, up 1pp. This put its cumulative hold on the market at 1.4% after a weaker January.

Two BYD models closed out February’s table. The BYD Yuan Up, also known as the Atto 2, came ninth with 10,035 deliveries, down 38.7%. Its share slumped by 0.6pp to 1.5%. The model closed out the cumulative table in 10th with a 1.4% share.

The BYD Dolphin was next, seeing a more gradual sales decline of 4.6% to 9,761 units. This gave it a 1.4% grip on the market, up 0.1pp. The BEV came eighth across January and February with a 1.7% share.

BYD takes top two

The BYD Song Pro was the best-selling new PHEV across the world in February. It recorded 13,130 deliveries, which was down 33.5% year on year as its market share shrank by 0.7pp to 4%. It took second across the first two months of the year with a 3.7% grip on the global PHEV market.

The BYD Song Plus, also known as the Seal U, felt an even sharper decline. With results dropping 57.5%, it recorded 11,183 sales. The model accounted for 3.4% of all PHEV deliveries, down from 6.3% in February 2025. It came third in the cumulative table with a 3.6% share.

Not far behind in February was the Fang Cheng Bao Tai 7. First recording sales in the second half of 2025, it counted 11,078 deliveries in February, taking a share of 3.4%. However, it took first place and a 4% share across the first two months of 2026.

Fourth in February was the BYD Seal 6. Its sales dropped by 48.7% to 6,489 units. This drove its share down to 2% from 3% a year prior. The Aito M7 was close behind as its sales climbed by 24.5% to 6,479 units. This sent its share upwards by 0.8pp to 2% in the month.

Established models see declines

With 6,120 sales, deliveries of the BYD Qin Plus were down by 63.4%. Its share dropped by more than half to 1.9%. The Li Auto L6 was seventh with a 1.6% hold over the market, down from 3.1% a year earlier. It recorded 5,190 units, down by 60.6%.

First recording sales in September 2025, the Zeekr 9X managed 5,095 sales, taking a 1.6% share. The Jaecoo J7 strengthened its grip on the market by 1.1pp to 1.5%. This was thanks to a sales increase of 170.4% to 4,945 units.

The only European model in the PHEV top 10 was the Volvo XC60. It managed 4,772 sales in February, down by 22.3% year on year. However, it was able to maintain its 1.5% market share.

Both battery-electric vehicle (BEV) and plug-in hybrid (PHEV) markets saw volumes plummet in China during February. But what is driving these declines, and which models came out on top? Autovista24 special content editor Phil Curry explores the figures.

Following a difficult January, BEV and PHEV markets in China plummeted for a second month, according to EV Volumes’ data.

BEV deliveries declined by 39.2%, with 262,698 sales in the month. Meanwhile, PHEV registrations fell 40.5%, with just 169,699 units leaving showrooms.

As a result, BEV sales were down by 29.7%, with 609,513 deliveries after two months of 2026. PHEV volumes suffered more, as the 390,576 tally was 37.9% down compared with the same period last year.

Increased model diversity has impacted the popularity of 2025’s best-selling options so far this year. This also suggests the appetite for new EVs in China is starting to wane.

Tesla leads the way in China

The Tesla Model Y led China’s BEV market in February, with 25,136 sales in the month. The crossover SUV struggled in the second month of 2025, but bounced back this year, increasing 214% year on year.

Tesla often prospers in the end-of-quarter months due to its reporting patterns. This result in February highlights the turbulence of the Chinese market. The Model Y accounted for 9.6% of all local BEV sales in the month, up by 7.7 percentage points (pp).

Second was the Xiaomi YU7, which only began recording domestic sales in June 2025. The model was the most popular in China during January. However, its 20,086-unit tally in February was markedly down on this performance. It accounted for 7.6% of total BEV deliveries.

The Li Auto I6 rounded out the top three. Another relative newcomer, it saw sales begin in September 2025. A total of 15,997 units made their way onto Chinese roads in February.

China’s top three BEVs were split by an even amount of almost 5,000 units between each position. This contrasted with the dominance of the Xiaomi YU7 in January. The result suggests buyers may be looking around in a more diverse market. Last year’s leading models appear to be struggling, as the country’s market faces headwinds.

Popular models struggle

Tesla saw its Model 3 place in the Chinese top 10, taking fourth in the month. With 12,758 units sold, this was a 32% year-on-year slide. The US BEV was responsible for 4.9% of deliveries, and due to competitor declines, this was an increase of 0.6pp.

Last year’s best-seller, the Geely Geome Xingyuan, only managed fifth in February, with its 11,906-unit total down by 58.4%. The model has seen a slower start to 2026, suggesting it may not be able to live up to its performance last year.

Sixth was the Nio ES8, which saw volumes increase dramatically since September last year. Its 11,779 units marked a 2,359.1% increase compared to February 2025, while a 4.5% market share was up 4.4pp.

A pair of BYDs followed, with the Dolphin seeing stable results in seventh. A total of 6,006 units represented a decline of 0.1%. In eighth was the BYD Seagull, which saw numbers plummet by 78.6%, as just 5,779 units were sold.

Next came another pair of models, with the Wuling Bingo Plus seeing 5,263 sales, a 45.3% rise compared to the same point last year. Rounding out the top 10 was the Wuling Mini, the second-best-selling BEV in China last year. With 5,230 deliveries, volumes were down 76.3%. This was only good enough for a 2% market share, a drop of 3.1pp.

Xiaomi proves popular

February’s top three all featured in the top cumulative positions spanning the first two months of 2026.

Thanks to its strong result in January, the Xiaomi YU7 led the way. With 58,010 sales, it held 9.5% of the market, a sizeable 14,802 units ahead of its nearest challenger.

This was the Tesla Model Y, which started 2026 much stronger than last year. With 43,208 units, it represented 7.1% of BEV sales and ended the two-month period 10,335 deliveries ahead of third place.

This position was taken by the Li Auto I6, recording 32,873 sales. It took a 5.4% share of the country’s BEV market between January and February.

While these BEVs soared, both the Geely Geome Xingyuan and the Wuling Mini struggled. The Geely model took fifth after two months with 26,793 sales. Meanwhile, the Wuling Mini did not feature in the top 10, sitting 13th after two months of 2026.

Fang Cheng Bao up top in China

China’s PHEV market has been struggling for some time. However, while volumes were down year-on-year, there was some stability in model choice.

For the second successive month, the Fang Cheng Bao Tai 7 led the way. The BYD subsidiary brand saw 11,078 units sold in February. It represented 6.5% of China’s PHEV volumes in the month.

The BYD Song Pro took second, although its 9,307-unit total was 37.9% down year on year. While the domestic brand placed five models in the top 10 during the month, none of them managed to see volume increases. As a popular PHEV brand in recent years, this decline is likely contributing to the market’s struggles.

Third went to the Aito M7, with the PHEV variant responsible for 3.8% of all deliveries, a 2pp rise. Its 6,479 sales were an increase of 24.5% compared to February 2025.

BYD volumes plummet

Both of last year’s top two models struggled in February. The BYD Qin Plus saw sales plummet 66.9% as just 5,252 units left forecourts. This was enough for a 3.1% market share, down 2.5pp.

It was followed by the BYD Seal 6 with 5,159 deliveries, down 59.1%. A 3% hold of the PHEV total was down 1.4pp compared to 12 months prior.

Sixth was the Zeekr 9X with 5,082 units sold, having only entered the market in September 2025. It also held a 3% market share. The Li Auto L6 was next. The medium SUV struggled in February, with its 4,746 sales down by 63.9% year on year. It claimed 2.8% of the market, a 1.8pp drop.

Following it in eighth was the Wey Gaoshan. First recording sales in September 2023, its numbers started ramping up in the middle of 2025. Its 4,133-unit total was a jump of 1,105% compared to February 2025.

Rounding out the table was another pair of BYD vehicles. The Song L suffered a 59.5% fall as 3,724 units were sold in the month. The BYD Qin L took 10th, with 3,603 units, a 77.8% fall in volumes. This was the biggest decline in the top 10.

Close battle for PHEV models

After leading the sales in both January and February, the Fang Chen Bao Tai 7 led the cumulative table. With 28,631 units delivered, it held 7.3% of the market, 10,251 units ahead of its nearest competitor.

In second, after two months of 2026, was the Aito M7. It saw 18,380 units delivered in the period, taking a 4.7% market share. After a strong result in January, it slipped back towards the BYD Song Pro, which held third, but was only 423 units behind. The BYD model accounted for 17,957 units between January and February. This resulted in a 4.6% share of the market.

As new electric-vehicle (EV) sales continued to climb in Europe, two models have taken an early lead. But just how close is the competition? Tom Hooker, Autovista 24 journalist, reviews the figures.

Europe’s new EV market managed a 21.4% year-on-year growth in February. A total of 289,194 models were delivered in the month, according to EV Volumes. This was just 198 units more than in January. Over the first two months of 2026, EV sales increased by 20%, with 578,190 sales.

However, splitting the EV market into its two respective powertrains reveals unequal growth. While plug-in hybrids (PHEVs) saw greater improvements, battery-electric vehicles (BEVs) continued to record significantly higher volumes.

PHEVs posted a 34.8% year-on-year increase to 97,104 units in February. This contrasted significantly with 12 months prior, when deliveries dropped by 1.4%. From January to February, new PHEV sales rose by 33.7% to 198,006 units.

However, this sales figure was still 182,178 deliveries behind BEVs for the first two months of 2026. In this period, all-electric models enjoyed a smaller double-digit increase of 14% to 380,184 units. February alone saw a 15.6% year-on-year rise to 192,090 sales.

Tesla tops BEV market in Europe

The Tesla Model Y was the best-selling BEV in Europe in February and the cumulative figures. It was also the continent’s best-selling EV, with over double the volume of Europe’s most popular PHEV in February.

The crossover recorded 10,717 sales in February, outpacing the market’s growth with a 21.6% year-on-year improvement. This translated to a 5.6% share of Europe’s BEV market, up 0.3 percentage points (pp) from February 2025.

Between January and February, its market share was 1pp lower. Yet it still led the BEV best-sellers table, thanks to 17,544 deliveries. Just 635 units behind was the Skoda Elroq, which managed 16,909 sales, and a 4.4% share.

In February, the SUV recorded 8,560 sales, trailing the Tesla Model Y by 2,157 units. However, the Elroq still enjoyed a 462% year-on-year increase in deliveries.

The Skoda Enyaq followed in third, a further 2,134 units behind its sibling. The BEV posted a 17.2% year-on-year increase in February to 6,426 deliveries. After two months of 2026, it sat fourth in the cumulative figures.

Meanwhile, fourth in February went to the Tesla Model 3. On the surface, this seemed like a poor result, with a 7.8% drop in deliveries to 6,329 units. However, it marked a significant recovery from January. The sedan’s 1,105-unit total in the month marked its lowest sales figure since July 2022.

Combined, the Renault 5 and Alpine A290 finished fifth in February. Yet the hatchbacks suffered a 0.5% dip in volumes to 6,265 units. After the first two months of 2026, the duo sat third in the best-sellers table with a 3.8% market share.

Leapmotor’s record result

The Leapmotor T03 provided a surprise in February. The city car achieved a record monthly sales total of 6,111 units, taking sixth in the best-sellers table. This ensured a 655.4% year-on year jump in deliveries.

Across January and February, the model recorded 8,080 deliveries, making it the eighth most popular all-electric model in the period.

Behind the A-segment model were four more familiar faces in Europe’s all-electric market. The Volkswagen (VW) ID.4 claimed seventh in February, with 5,159 deliveries. However, this equated to a 15% drop on 12 months prior. The BEV sat sixth in the cumulative table between January and February.

Eighth in February’s standings went to the VW ID.3. The hatchback suffered a 10% fall to 4,860 sales, bringing its total volume in 2026 to 10,336 units. This was enough for fifth in the year-to-date best-sellers table.

The VW ID.7 was ninth in February, after a steeper 24.2% year-on-year drop to 4,093 sales. This left it seventh in the cumulative chart.

Rounding out February’s top 10 was the Audi Q4 e-tron, with its 3,914-unit total down 21.9%. The SUV was also the 10th best-selling BEV after two months of 2026.

This meant that alongside the top three best-selling models, only the Leapmotor T03 managed year-on-year growth in February.

BYD dominates PHEV market in Europe

Two months into 2026, the BYD Seal U led Europe’s new PHEV market. The SUV was comfortably out ahead with a 5.2% market share thanks to 5,029 sales. This translated to a 130.9% improvement year on year.

The BYD Seal U’s dominance proved even more profound in the cumulative standings. It took a 5.9% share of all PHEV deliveries between January and February, with 11,732 deliveries.

This was 4,197 units ahead of the VW Tiguan, which took second after two months of 2026. Out of the models’ 7,535 sales so far this year, 4,007 were recorded in February alone. This ensured 10.1% growth year on year. It also placed second in the monthly chart.

Volvo and Ford suffer declines

The Volvo XC60 took third in February, with a 10.9% decline to 3,594 deliveries. The SUV also claimed third in the cumulative table, with 7,244 units. Fourth in February went to the Ford Kuga, which also suffered a delivery drop. It saw a 11.9% fall to 3,160 sales, punching above its standing in the year-to-date table of sixth.

The Mercedes-Benz GLC finished fifth in February, thanks to a 78.9% year-on-year surge to 3,059 sales. The PHEV also took fifth in the cumulative chart.

Next were two BMW models: the X3 and X1. The former secured sixth with a 48.9% rise to 2,827 deliveries. Meanwhile, the BMW X1 posted a smaller increase of 6.4% to 2,786 sales, enough for seventh in the best-sellers table. The X1 took ninth in the cumulative standings, while the X3 slotted into seventh.

Contrasting performances for Chinese models

The Jaecoo J7 took eighth in February’s chart. Volumes soared by 447% year on year to 2,779 sales, taking a 2.9% share of the market. The PHEV sat fourth after two months of 2026, with 7,075 deliveries.

Toyota’s C-HR took ninth in February, despite a 21.7% year-on-year drop to 2,373 sales. The SUV placed eighth in the cumulative table.

BYD placed two PHEVs in the European monthly top 10. This was thanks to the BYD Atto 2’s surging performance, which allowed the brand to bookend the table. The model first recorded European sales in October 2025, with a previous best of 85 units in January.