Insights

Tagged:
Clear filters
Industry
Topic
Segment
Two people at table reviewing an Insurance Plans application form with calculator

Press Release

Auto Insurers Struggle to Maintain Seamless Interactions Across Channels, JD Power Finds

TROY, Mich.: 9 June 2026 — As the auto insurance market continues to soften, customers are holding more of the power—and they’re using it, according to the JD Power 2026 U.S. Auto Insurance Study,SM released today. Separate JD Power data[1] indicates that approximately one‑third of auto insurance shoppers now turn to artificial intelligence (AI) tools when comparing coverage, and those who do are significantly more likely to switch insurers. Yet even as competition intensifies and prices ease, an increase in overall customer satisfaction is being held back by insurers’ inability to deliver truly seamless interactions across channels.
""|Image 1 (MSRP variability / F-150 example): “Chart showing a wide MSRP range for the same 2024 Ford F-150 Lariat 4WD SuperCrew trim

News

Vehicle Configuration Complexity and Strong Used-Vehicle Market Wreak Havoc on Auto Insurance Valuation Models and Carrier Profitability 

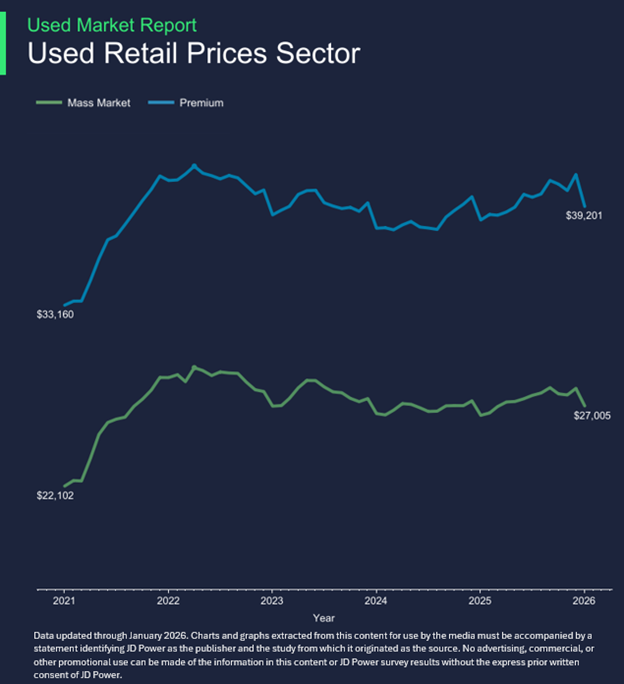
Vehicle configuration complexity has increased exponentially over the last 10 years, primarily driven by a shift from mechanical systems to "software-defined" architectures, with over 600,000 unique vehicle configurations sold in North America in the 2025 model yearAverage used-vehicle retail prices have risen 20% in the past five yearsAuto insurance actuarial models built on incomplete vehicle identification data could be off by upwards of $15,000 per vehicle Henry Ford famously said that customers “could have a Model T in any color they want—so long as it was black.” Today’s automotive market could not be more different. Vehicle customization has exploded over the past decade as automakers compete to meet increasingly specific consumer preferences. For example, in the large pickup truck segment, the Ford F-150 currently has upwards of 100,000 unique build configurations and, market-wide, more than 600,000 unique vehicle configurations were sold in the United States in the last year alone, according to JD Power data.While this level of customization has benefited consumers and automakers, it has created a growing challenge for auto insurers. Many actuarial models used to price and underwrite policies still rely on simplified vehicle identification data that cannot fully capture the configuration and replacement value of modern vehicles. At the same time, volatility in used-vehicle pricing and rising repair costs are further complicating valuation models that were built for a far more predictable market.This combination of vehicle complexity and market volatility is creating a widening gap between the values insurers assume during underwriting and the costs they ultimately face when repairing or replacing vehicles after a claim.This Insurance Intelligence Report explores key data points gathered from JD Power studies and proprietary market data to offer a data-driven perspective on the current state of insurance industry vehicle valuations. Widespread MSRP Variability Within the Same TrimOne of the most significant challenges insurers face today is the dramatic variability in vehicle pricing—even among vehicles that appear nearly identical on the surface. Automakers now offer a wide range of factory-installed options, packages and custom features that can dramatically affect a vehicle’s price. From advanced driver assistance systems (ADAS) and upgraded powertrains to premium interiors and specialty paint packages, two vehicles with the same year, make, model and trim can have vastly different original values.For example, a 2024 Ford F-150 Lariat 4WD SuperCrew with a 5.5-foot bed could have been sold for approximately $69,630 with standard options, while a fully optioned version of the same vehicle could reach $84,465, according to JD Power data. For insurers, this creates a consequential underwriting blind spot. Unless they have access to the full 17-digit vehicle identification number (VIN) and the corresponding OEM build data tied to that VIN, they may not know which configuration they are actually insuring—creating up to $14,835 in unknown price variability.Many insurers rely on a shortened VIN identifier—often referred to as a “squish VIN”—when building underwriting models or quoting policies. While this truncated VIN provides basic information such as year, make, model, and sometimes trim level, it lacks the detailed configuration data needed to accurately assess a vehicle’s full replacement value.As vehicle configuration complexity continues to increase, reliance on simplified vehicle identification methods can introduce significant pricing inaccuracies into underwriting models.The Great Used Vehicle Price ResetVehicle complexity is only part of the challenge. The used-vehicle market has also undergone significant structural changes over the past several years.The average used-vehicle retail price is now $29,488, reflecting a more than 20% increase over the past five years, according to JD Power data. Much of this increase can be traced to supply shortages caused by pandemic-era production disruptions, which limited the availability of late-model used vehicles entering the market. For insurers, this volatility creates another modeling challenge. Traditional valuation models have long relied on the assumption that most mass-market vehicles depreciate roughly 20% per year. However, recent market dynamics have disrupted those historical depreciation patterns.Take the earlier example of the 2024 Ford F-150. Today, that vehicle is worth approximately $50,965, representing a 28% decline from its original MSRP. Under traditional depreciation models, insurers might have estimated the vehicle’s current replacement value at roughly $55,165, resulting in a $4,200 gap between projected and actual value. EV’s are further complicating traditional valuation models as EVs are projected to lose 59% of their value over five years, compared to an industry average of 46% for all vehicle types, according to JD Power data.Across millions of insured vehicles, valuation discrepancies like this can meaningfully impact claims severity and insurer profitability. More Tech, More ProblemsAnother major factor complicating insurance valuation models is the rapid expansion of vehicle technology. Modern vehicles increasingly include ADAS such as automatic emergency braking, adaptive cruise control, lane-keeping assistance and collision avoidance technologies. While these features improve safety and help reduce the likelihood of severe accidents, they can significantly increase repair costs when collisions occur.Sensors, cameras and radar modules are often embedded in bumpers, mirrors, windshields and body panels. Even minor accidents can require expensive sensor replacements and complex recalibration procedures.Accurately modeling this risk requires insurers to know precisely which safety technologies are installed on each vehicle they insure. Without accurate, detailed VIN-level configuration data, insurers may not have visibility into which vehicles contain these systems and which do not—introducing further uncertainty into repair cost projections. AI TransformationAs insurers increasingly adopt AI-driven underwriting, claims automation and pricing optimization tools, the importance of accurate foundational data becomes even greater. Artificial intelligence models are only as effective as the data used to train them. Without precise vehicle configuration and valuation inputs, AI systems risk amplifying inaccuracies rather than improving decision-making.Insurers that modernize their vehicle data infrastructure will be better positioned to price risk accurately, control claims severity and maintain profitability in an increasingly complex automotive landscape. Cracking the CodeWith the average new-vehicle transaction price now exceeding $46,000, insurers should expect continued upward pressure on vehicle repair and replacement costs. However, rising costs do not necessarily mean insurers must accept greater pricing uncertainty.Insurance has always been about accurately measuring and pricing risk. In today’s competitive environment, doing so requires more precise data about the vehicles being insured.As vehicle complexity has accelerated, insurers need to be able to track more detail than what’s currently available in “squish vin” datasets. Access to full 17-digit VIN configuration data, OEM build information, real-time vehicle valuation insights and feature-level vehicle attributes can help insurers build more accurate underwriting models, improve claims severity forecasting and better align pricing with actual risk. What Lies AheadFor an insurer, moving from generic VIN decoding to precise, configuration-level data transforms the business from reactive to surgical. As vehicles have become "computers on wheels," with significant price variations, knowing the exact build data—not just the year, make, and model—is the difference between profitability and a loss ratio spike.After years of record rate increases and now that pricing issues have been resolved, auto insurance carriers are pulling out all the stops to grow. By shifting from broad vehicle categories to precise, VIN-level configuration data, insurers are gaining the pricing confidence needed to aggressively target new growth opportunities by selling to a broader set of consumers with varying degrees of risk. Find out MoreThis Insurance Intelligence Report was authored by James Vecchio, Head of VIN Products at JD Power. The analysis draws on JD Power studies, proprietary market data, and VIN‑level configuration and valuation intelligence, including insights derived from the JD Power StudyPrice 2.0 tool, which decodes the full 17‑digit VIN to reflect a vehicle’s exact build profile.JD Power Specialty Vehicles provides P&C insurance carriers with advanced decoding and valuation products for powersports, marine, recreational vehicles, classic cars, commercial trucks, and manufactured housing. Available via subscription, our data is the most accurate and robust in these industries—trusted by more than 90% of the market.To learn more about the research, underlying methodology, or vehicle valuation capabilities available to insurers, please contact the JD Power Insurance Intelligence team.Media ContactsBrian Jaklitsch; East Coast; 631-584-2200; [email protected] LaMuraglia, JD Power; East Coast; 714-621-6224; [email protected]
Senior couple meeting a financial advisor with laptop over coffee

News

How Top Ranked Banks Win in 2026: Turning Customer Intelligence and Recognitions into a Marketing Advantage

A marketer’s guide to leveraging regional customer satisfaction insights to strengthen trust, loyalty, and brand differentiation.Banking Customer Insights driven by JD Power ResearchIn today’s crowded financial services landscape, customer experience has become one of the most powerful—and credible—marketing differentiators. With more than half of retail banking customers open to switching banks within the next year, marketers face a clear mandate: earn trust, prove performance, and communicate value in ways that resonate locally and emotionally.For CMOs and agencies serving retail banks, this environment elevates the importance of unbiased, third‑party customer insights. Data‑driven performance signals not only inform smarter marketing strategies—they also provide the proof points that build confidence, credibility, and brand preference.Unbiased customer insights help banks understand what matters most, allowing banks to craft more effective marketing strategies. Messaging should resonate with regional audiences while reinforcing the bank’s reputation as a trusted institution. By addressing the priorities of different customer segments, banks can fight attrition and strengthen their competitive position. Regional Variations in Customer Satisfaction A one-size-fits-all national approach can fall short in addressing local market differences—especially those around trust and reputation. JD Power research reveals that customers in the New England, Northwest, Upper Midwest and California regions have lower-than-average scores on critical-to-success metrics. These include overall satisfaction; level of trust; likelihood to say they definitely will reuse the bank; and reputation. This regional performance gap is driven in part by a divide among age groups. For example, Gen Z customers in California have a lack of confidence in regional and midsize banks and a preference for national banks. The opposite is true in the New England and Upper Midwest regions, where Gen Z customers display a lack of confidence in national and regional banks and a preference for midsize banks.Banks on both sides of the size equation must proactively highlight their reputation for satisfying customers to win new business and retain existing accounts. Marketing Strategies Based on Data-Driven Regional Insights Effective regional marketing requires a nuanced and informed approach with strategically tailored messages that speak to regional customer preferences. Regional marketing campaigns help banks to meaningfully engage customers, reinforce a reputation for exceptional customer satisfaction, and build lasting relationships that inspire retention. Marketers can make the most of regional consumer data with messaging that meaningfully addresses the concerns of regional banking customers. Emphasizing Reputation and SecurityA bank’s reputation remains a top reason why customers select a bank, while “security/fraud” is the main reason why customers replace a previous checking account with a new one. Marketers should highlight credible proof of performance, customer satisfaction, and the bank’s demonstrated strength in security and fraud prevention to reinforce and promote their bank’s positive reputation in regional markets. By pairing marketing efforts with both reputation management and clear communication of security and fraud‑prevention capabilities – grounded in real‑world customer experience data – banks can more effectively communicate their trustworthiness, their commitment to protecting customers, their ability to deliver a satisfying experience, and their overall brand valueDeveloping Regionally Tailored Campaigns Banking customers in different regions have distinct priorities and expectations when choosing and working with a financial institution. To connect with customers effectively, banks must create tailored campaigns that address regional concerns, demonstrate their commitment to local markets and highlight how they meet customer needs. Final Thoughts The banking landscape is changing rapidly. Staying competitive relies on leveraging every advantage. Credible third-party customer insights are more important to marketing efforts across the banking industry than ever before, especially for banks serving clients in a variety of regions and those competing with national players.Customer insights from reliable sources are useful to banks looking to stand out in a competitive market and understand how they perform when compared with national and regional competitors. Data-driven rankings and recognitions also help consumers avoid exhaustive searches and piecemeal comparisons, saving time, and frustration, and giving a more accurate picture of available choices. The results of the JD Power 2026 U.S. Retail Banking Satisfaction Study are coming soon. Stay tuned for the results. In the meantime, explore insights from the JD Power 2025 U.S. Retail Banking Satisfaction Study. Read the 2025 press release >[1] JD Power defines generational groups as Pre-Boomers (born before 1946); Boomers (1946-1964); Gen X (1965-1976); Gen Y (1977-1994); and Gen Z (1995-2006). Millennials (1982-1994) are a subset of Gen Y.
Hands using laptop & smartphone with credit card at cafe (digital banking)

News

Financial Services Churn Data and Analytics Report Q4 2025

The following is based on data gathered through the JD Power Churn Data and Analytics 2025 fourth-quarter report. Review insights on this quarter's results in the latest industry briefing: FinTech Brands Continue to Attract and Convert New Banking and Investment Accounts Checking SavingsWho is Acquiring the Most New Accounts?Chime captures the highest share of checking account openings and is most effective at turning considerations into new accounts. This mirrors results from Q3 2025. Do Those Open Rates Hold True by Affluency? Chime maintains its leadership among the Mass Market, but Bank of America and Chase capture the highest percentage of new accounts among the Affluent and Mass Affluent. SAVINGS ACCOUNTWho is Acquiring the Most New Accounts? Chase outpaces Chime in new savings account openings, but Chime converts the most considerations into new accounts. Do Those Open Rates Hold True by Affluency? Chime leads in savings account openings within the Mass Market, but Chase, Bank of America, Wells Fargo, and Capital One win the most Mass Affluent and Affluent new savings accounts. INVESTMENT ACCOUNTWho is Acquiring the Most New Accounts? Chime captures the highest share of checking account openings and is most effective at turning considerations into new accounts. This mirrors results from Q3 2025.. Do Those Open Rates Hold True by Affluency?Chime leads in savings account openings within the Mass Market, but Chase, Bank of America, Wells Fargo, and Capital One win the most Mass Affluent and Affluent new savings accounts. About JD Power Churn Data AnalyticsJD Power U.S. Financial Services Churn Data & Analytics is a syndicated benchmarking study profiling the actions and experiences of customers opening new financial products/accounts in the U.S. The study includes the following consumer account types: checking, credit card, savings/money market, individual investment, HELOC/HELoan, personal loan, auto loan, and retirement. The key metrics in this study track the opening and closing (“churn”) of customer financial accounts among institutions. Contact our team to get the full results. Make sure you are on the list to get the latest report as soon as it is published.
""|View the 2025 Q4 Financial Services Churn Data and Analytics Report

News

FinTech Brands Continue to Attract and Convert New Banking and Investment Accounts

Chime sees highest new customer acquisition for checking accounts and conversion rates for checking and savings accountsFidelity leads on new investment account openings, SoFi leads on investment account conversion rateBank of America and Chase capture highest percentage of mass affluent and affluent banking customers The “soft switching” phenomenon, whereby banking and investment services customers are opening secondary accounts and quietly making them their primary relationships, continues for a second consecutive quarter in the JD Power Financial Services Churn Data and Analytics report.The report, which tracks customer attrition among the nation’s leading financial services providers, finds that FinTech brands, such as Chime and SoFi have become the biggest beneficiaries of this trend, attracting and converting new account openings faster than more established financial services brands. The trend is particularly noteworthy in the mass market banking segment, while traditional brands continue to lead on new account openings in the mass affluent and affluent banking segments[1]. Chime Leads on New Bank Account Openings and ConversionsJust under half of new checking (49%) and savings (46%) account openings in the fourth quarter of 2025 were for secondary accounts, opened by customers who already have an existing banking relationship, while 26% of checking and 18% of savings account openings were replacement accounts. Brand new banking relationships among customers who did not previously have a banking or checking account represented 25% of all checking and 36% of all savings account openings. This pattern of secondary account opening, which is consistent with Q3 2025, suggests that more banking customers are expanding and diversifying away from their primary deposit relationships. Chime claimed the largest share of new checking account openings in Q4 with 12.8%. It was followed by Chase (8.4%) and Wells Fargo (7.1%). Among new savings account openings, Chase saw the largest overall market share at 9%. It was followed by Chime (8.4%) and Bank of America (6.3%).One area where Chime has continued to show strength for a second consecutive quarter is its conversion rate—the percentage of time the checking account was opened with the bank after customers evaluated other brands. Overall, Chime has the highest conversion rate for customers who considered opening checking (78%) and savings accounts (85%). For both checking and savings accounts, Chime consistently outperformed both FinTechs and more established brands on new account conversion. Bank of America and Chase Win More Affluent Banking CustomersWhen it comes to targeting higher income, and higher net worth, customers, the Big Four national banks are outperforming FinTech brands. Among checking account openings, Chime led on customer acquisition in the mass market segment, claiming 11.5% of new customers, while Chase led in the mass-affluent segment, with 10.9% of new customers, and Bank of America led in the affluent segment, with 14.1% of new customers in Q4. A similar trend played out in savings accounts, where Chime led mass market customer acquisition with 11.5% market share, and Chase led in both the mass affluent (9.7%) and affluent (11.5%) segments. Investment Account Openings, SoFi Converts More CustomersIn the investment account category, Fidelity claimed the largest share of new account openings in Q4 with 16.8%. It was followed by Charles Schwab (9.1%) and Robinhood (8%). When it came to new account conversions, however, FinTech brand SoFi claimed the lead, capturing 83.1% of accounts that were opened after other brands were evaluated. SoFi was followed by Fidelity (80.2%) and Acorns (78.2%) When segmenting customer acquisition by total investible assets, Fidelity maintained the top position among mass market (16.3%), mass affluent (17.7%) and affluent (16.4%) customers. It is followed by Robinhood (10.5%) in the mass market segment and Charles Schwab in the mass affluent (10.8%) and affluent (13.1%) segments. A Mature Market Ripe for DisruptionThe findings in this report are noteworthy because they spotlight a critical transition point in the decision-making process of financial services customers as they evaluate a steadily growing list of brands and options for how to manage their money. We are clearly seeing a trend toward more consumer interest and experimentation with relatively new FinTech brands, particularly in the mass market segment. The fact that many of these brands are succeeding at converting customers suggests that effective digital engagement will play a major role in the future development of the financial services industry. Incumbent brands need to monitor this trend closely and make sure they are continuing to connect with the right customers at the right time with the right approach. Find out MoreThis Financial Services Intelligence Report is based on 263,151 responses collected as part of the JD Power Financial Services Churn Data and Analytics report between October and December 2025. It was authored by Jennifer White, senior director, financial services intelligence at JD Power. Please contact us at the numbers below to connect with the team or to learn more about the underlying research. Media Contacts Brian Jaklitsch; East Coast; 631-584-2200; [email protected] LaMuraglia, JD Power; East Coast; 714-621-6224; [email protected] [1] JD Power defines wealth categories for banking as Mass Market (income
Depiction of financial services and insurance churn as a customer rotates out of a bank entrance.

News

What is Customer Churn? How to Measure, Analyze, and Track Attrition

Churn is more than outright defection; it can also include silent attrition, where customers remain nominally active but reduce engagement, spending, or product adoption. High churn rates erode revenue, weaken loyalty, and limit growth potential. In highly competitive industries, such as financial services, insurance, and wireless service providers, churn reflects subtle shifts in customer behavior in shopping for rates, opening secondary accounts or moving business elsewhere. Accessing accurate churn analytics and benchmarking uncovers valuable insights to strengthen loyalty and improve performance. For example, “Insurers use LIST to understand which customer segments are defecting and to which insurers, on a regional basis, to inform targeted retention campaigns focused on retaining and winning back their most valuable customers, said Stephen Crewdson, managing director of insurance business intelligence at JD Power.The same principle applies across industries: organizations that can accurately measure and interpret churn data are better positioned to strengthen loyalty, anticipate market shifts and improve overall performance. How to Calculate Churn: Measuring churn starts with a simple calculation, but interpreting the results requires context. At its core, the customer churn rate shows the percentage of customers who stop doing business with a company over a given period.The Churn Rate Formula is:(Lost Customers / Total Customers at Start) * 100 = Churn Rate Key Considerations When Measuring Churn:Define the time frame: Monthly, quarterly, or annual churn rates based on typical customer lifecycle and usage patterns. Clarify what counts as churn: Determine if it includes silent attrition (reduced spending or dormant accounts) or only full customer loss?Account for acquisitions: Some businesses calculate net churn by factoring in new customers gained.Segment the data: Measuring churn by market, product, or demographic provides deeper insights than one topline figure.Accurately measuring churn rate is the foundation for customer attrition analysis, benchmarking performance against peers, and building strategies to decrease churn over time. How to Track Churn EffectivelyCapture the Entire MarketTrue churn measurement requires visibility into all customer movement across the industry. A market-wide view provides the competitive intelligence needed to benchmark churn against peers, identify where you’re losing ground and to who, and pinpoint opportunities to win customers back.Access Timely DataChurn is dynamic. Tracking in near real time ensures you see shifts in behavior as they happen, not months later, when it’s too late to act.Combine Quantitative & Qualitative InsightsNumbers reveal the “what” (who left, where they went, how many).Customer feedback reveals the “why” (reasons for attrition, perceptions, and loyalty drivers).Together, they provide a more addressable picture of churn dynamics.Tracking Churn across segmentsPinpoint where churn poses the greatest risk, prioritize retention resources accordingly, and develop targeted strategies to protect their most valuable relationships.For example, losing a high customer lifetime value (CLV) customer in insurance has a bigger financial impact than losing a low CLV customer.“Many brands measure their own churn rate but lack benchmarking data, so they don’t know if their rate is competitive or not, or if changes in their rate are due to a changing tide, said Miles Tullo, Managing Director, Financial Services Intelligence. JD Power provides benchmarking data so brands can compare their rates to specific competitors and the market average.” Why Customer Churn and Attrition MatterCustomer churn goes beyond tracking who leaves. It is a direct indicator of revenue risk, competitive pressure, and shifting customer expectations.Using churn data and analysis effectively improves business performance by: Protecting Revenue and Lifetime Value: Tracking customer attrition rate quantifies the direct impact on recurring revenue and CLV. Even small reductions in churn translate into significant financial gains over time.Safeguarding Brand Equity and Market ShareHigh churn rates often signal declining brand perception. By analyzing why customers leave, leaders can address service gaps before they erode market share or damage reputation.Exposing Competitive WeaknessesCustomer churn analysis highlights where product features, pricing, or service models fall short against competitors. These insights help organizations close gaps and win back share.Driving Segment-Level GrowthMeasuring churn by market, demographic, or even down to the zip code reveals patterns that enable precise, data-driven go-to-market (GTM) strategies and targeted retention campaigns.Building Loyalty and Retention ProgramsAccurate churn data forms the foundation for proactive retention strategies, from personalized outreach to loyalty programs, ensuring customers remain engaged and profitable. Getting StartedUnderstanding and addressing churn requires more than internal data alone. JD Power draws on decades of experience, large-scale customer panels, and proven methodologies to provide a comprehensive, near real-time view of customer shopping and switching intent and behavior across the financial services and insurance industry. Become a subscriber to better track and understand how your organization compares to peers and identify patterns that may signal risk or opportunity for company growth.

Displaying 12 of 109 insights